History
Looking to review your progress in time? The visits' history, the Core Web Vitals status distribution, worst pages by a specific metric, all meant for you to draw conclusions and define important strategies.
Controls
 The leftmost dropdown allows you to change the domain and open a settings modal, where you can view integration scripts with used resources, and disable or enable the script.
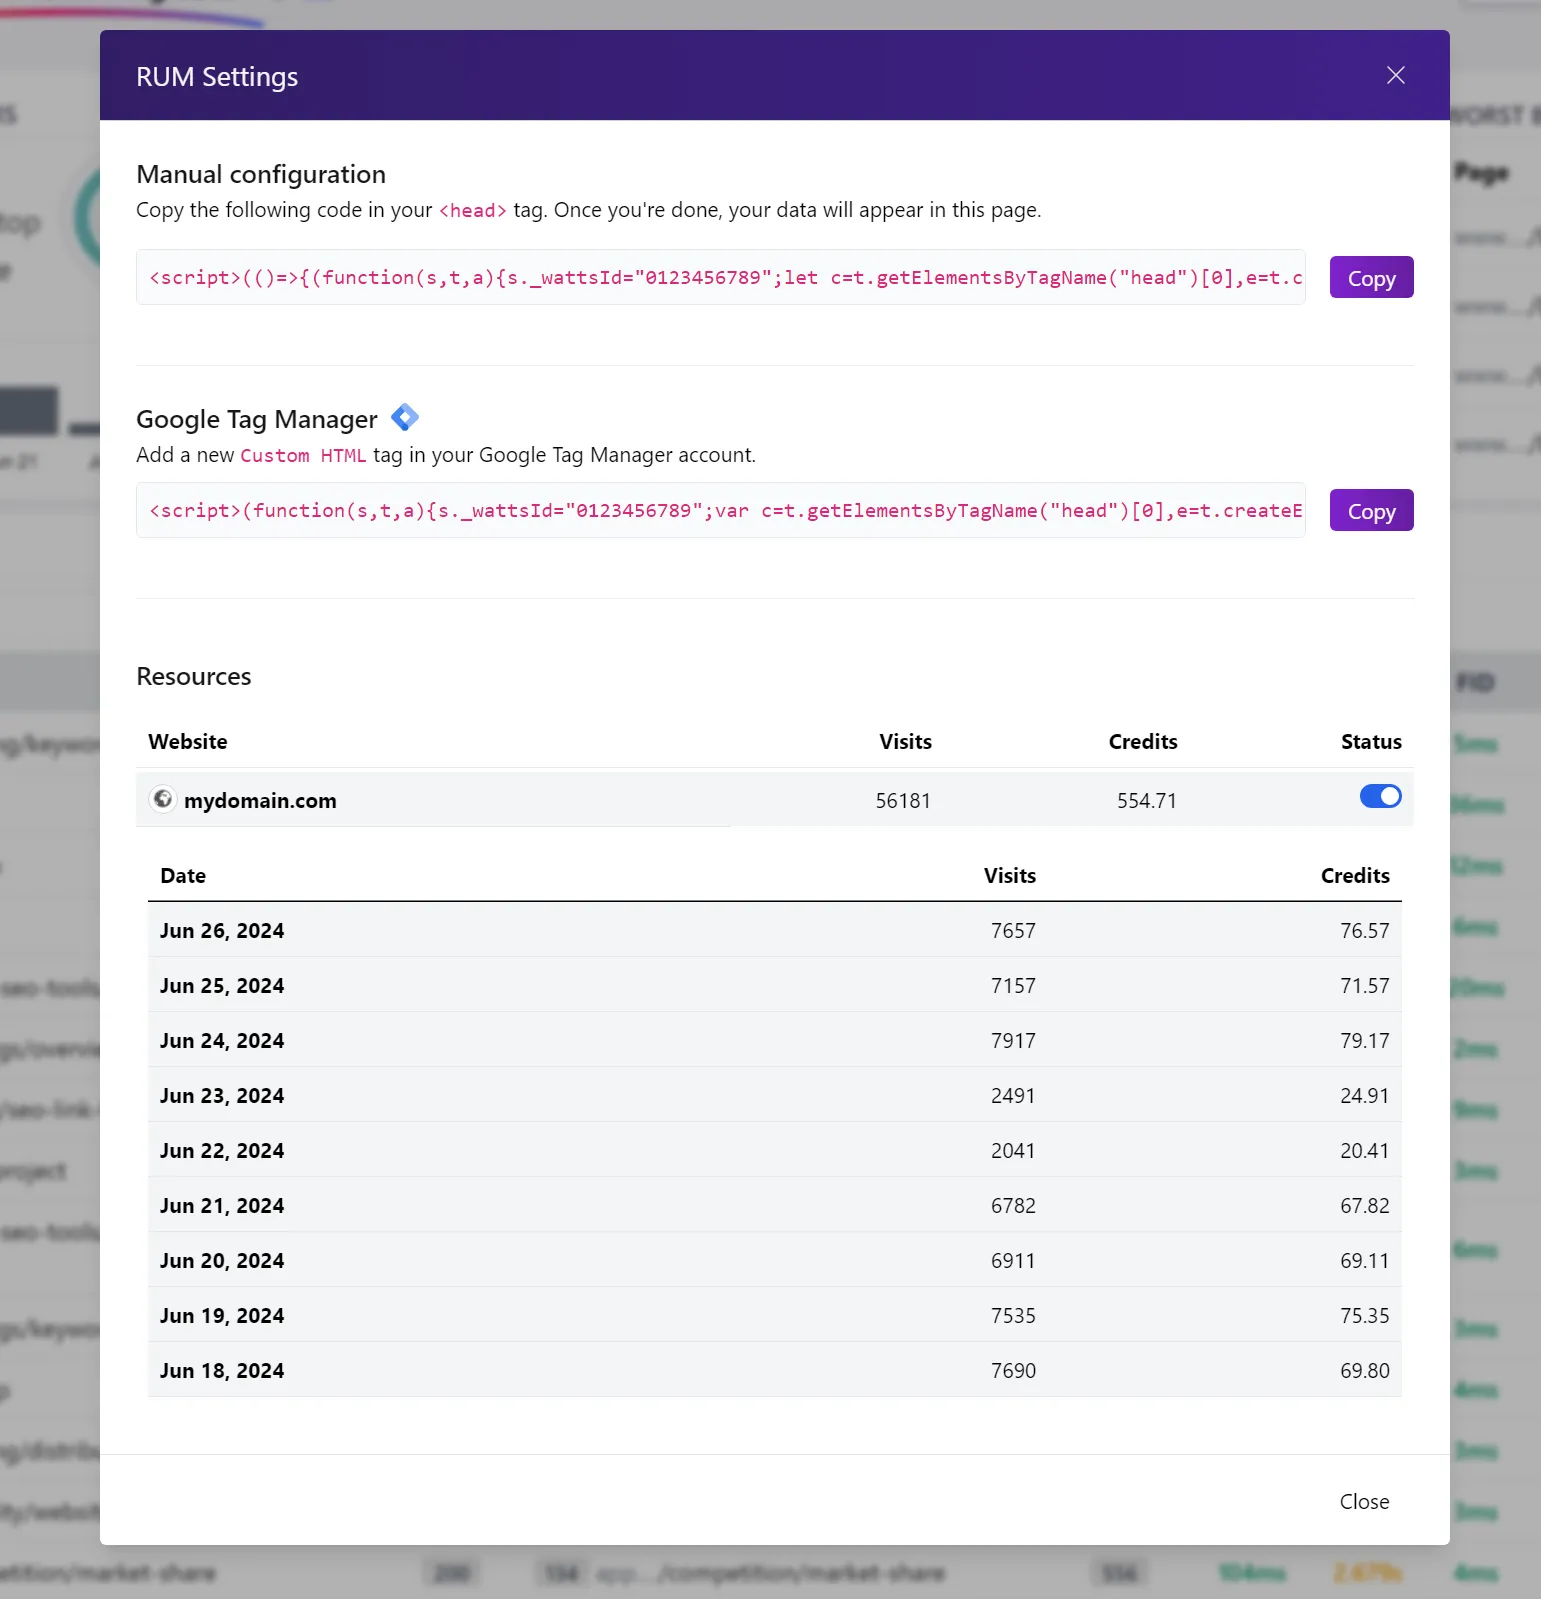
The controls from the right part of the report will allow to refine your report:
-
Date range: allows you to select a custom date range.
-
Origin: refers to the set of web pages associated with a specific website domain.
For example, if "example.com" is your domain, the origin "blog.example.com" would encompass all the pages hosted under the "blog.example.com".
-
Location: you can either see this report from all available locations, or filter by a specific one.
-
Core Web Vitals:
- 24 hours: the CWV are calculated only for the 00:00 - 23:59 interval of each day. Each bar in the chart represents that value. This is useful for example, when you want to discover the day when your Core Web Vitals have a big change.
- 28 days: the CWV are calculated for the last 28 days. Each bar in the chart represents the aggregated CWV for day - 28 days.
-
Device: Mobile, desktop or both.
1. Online users
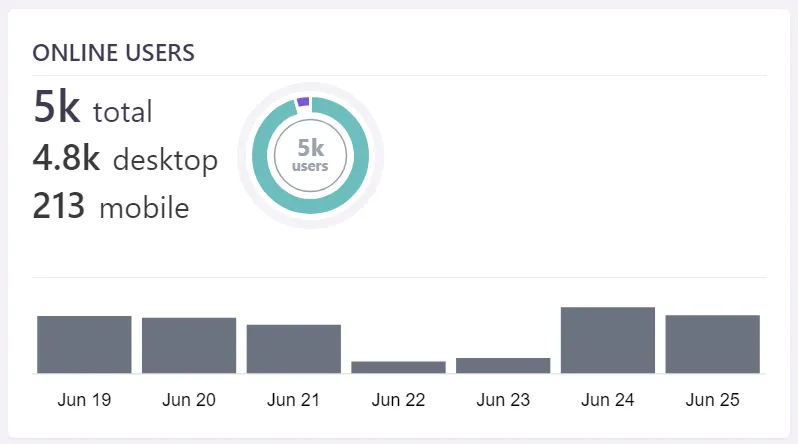
Shows the visits' history of your whole domain. The visits are displayed for both desktop and mobile, the bar chart being the history of your total visits from the selected day interval. Each bar is for a single day.
2. Core Web Vitals status distribution

To easily keep track of the number of pages that are failing/passing the CWV, keep an eye on this widget. Daily grouped, you can also check the percent of failing vs passing URLs.
3. Worst by metric
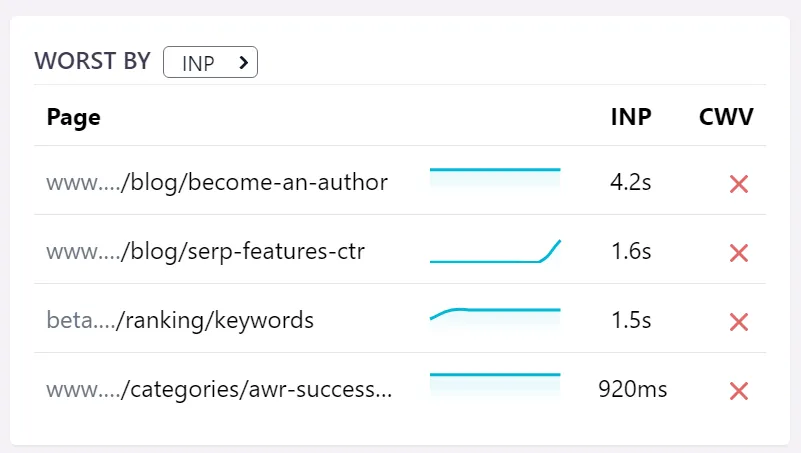
Discover the pages with low performance for each CWV metric. The charts will display the selected metric history for each page.
4. Top pages
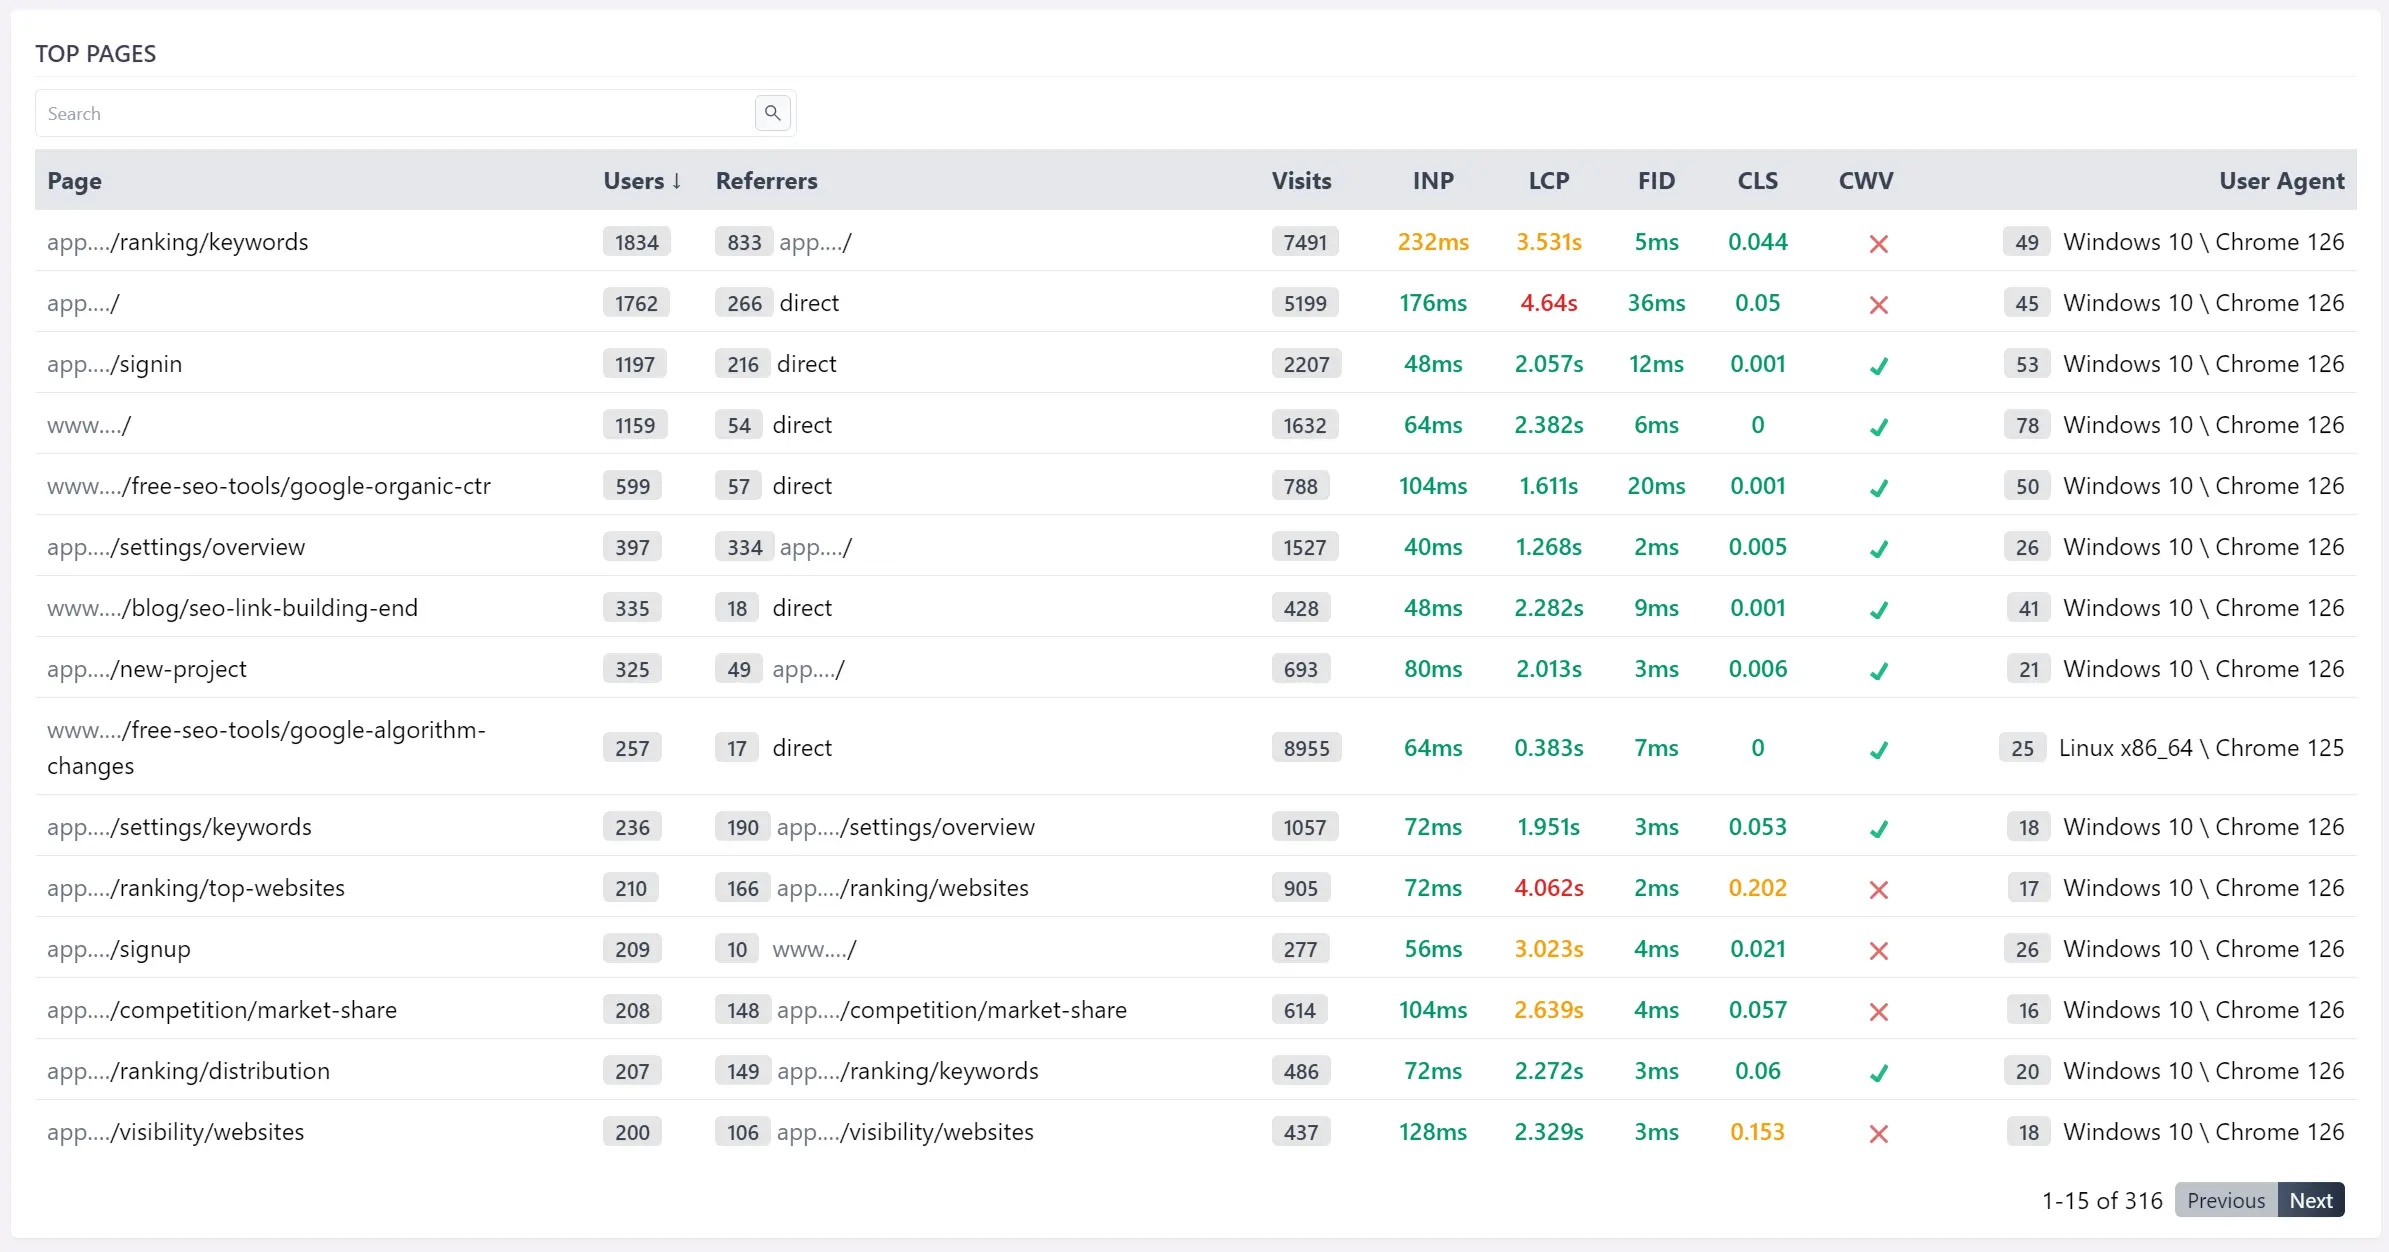
Shows all the pages that have minimum one visit in the selected date interval. By default, this table is sorted by users, so you will fist see the pages that are the most accessed.
- Page: the URL of the page.
- Users: number of distinct users that visited the page in the given time period.
- Referrers: The number of referrer URLs.
- Visits: the total number of visits.
- INP, LCP, FID, CLS: the Core Web Vitals metrics values.
- CWV: the Core Web Vitals status for this page.
- User-Agent: most common user agent. hover over the badge to see all of them.
Click on any table row to see the actual visits history along with the Core Web Vitals metrics.
5. Core Web Vitals
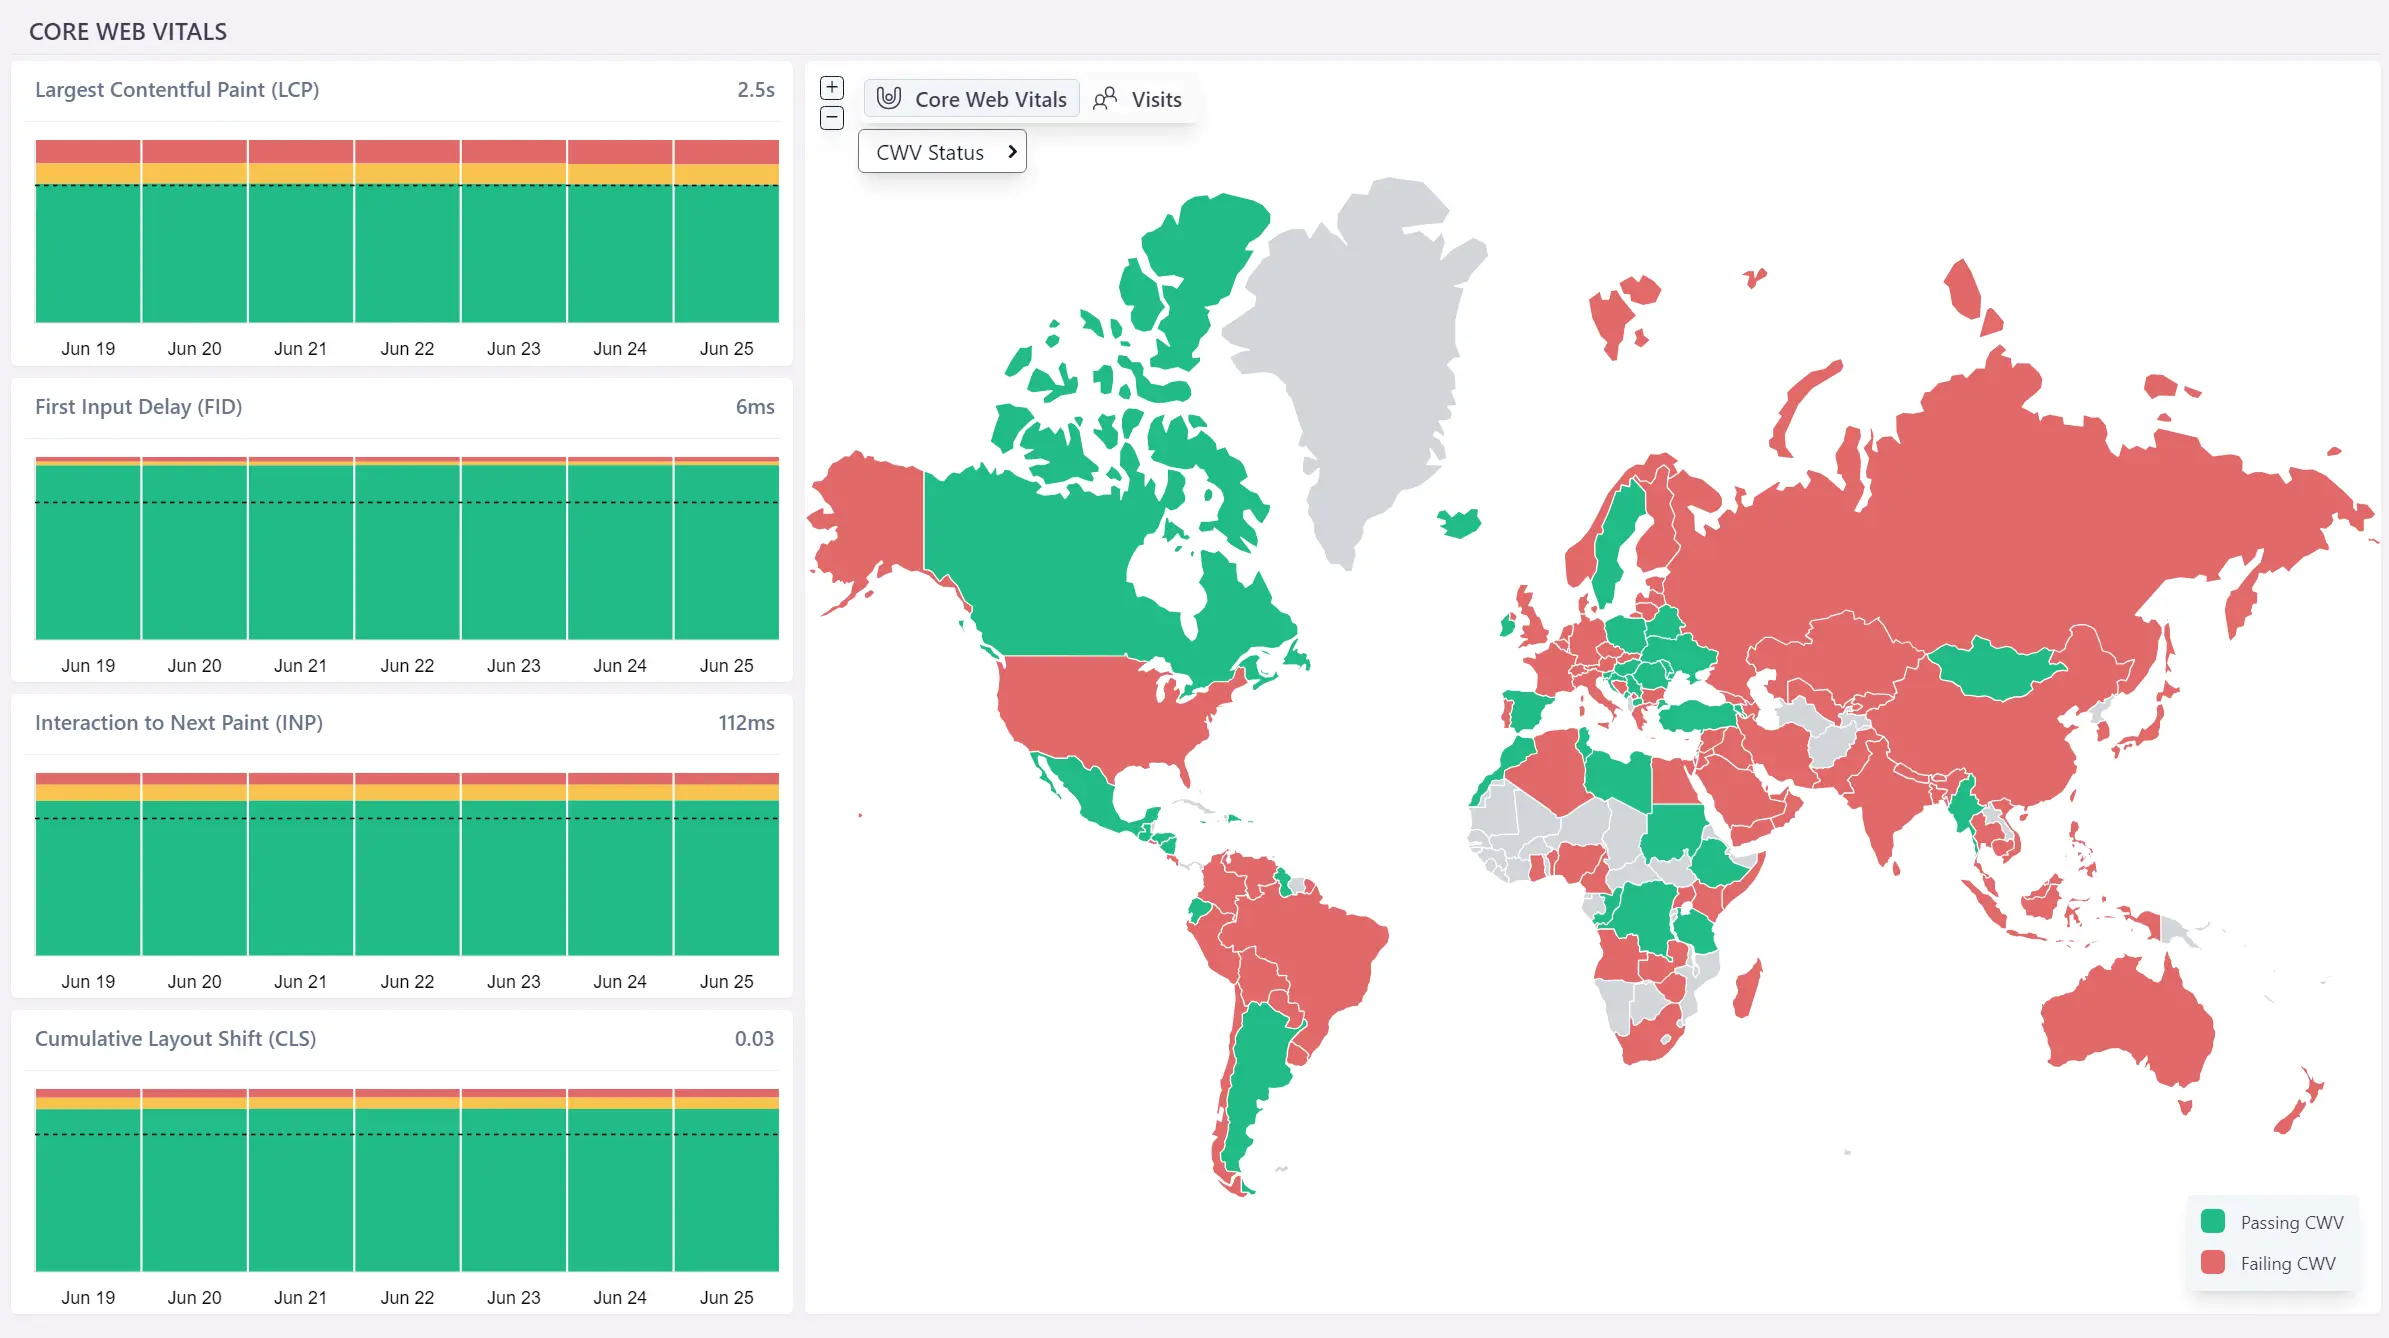
The CWV metrics calculated based on selected filters. Each bar in the chart represents one day. Check the horizontal markers to see if one of the metrics is failing at the 75th percentile.
While it is important to pass the Core Web Vitals worldwide, one thing that you can do to find the countries that are failing them, is to check this map.
The colors are self explanatory:
- green: countries that are passing the Core Web Vitals check
- red: countries that are not passing the Core Web Vitals check
Make sure to switch to the desired CWV metric in order to see how it performs from different countries. Also, you can see this map visits oriented.
Switching the Core Web Vitals control between 28 days and 24 hours will group each bar by day - 28 days or 24 hours period.