History
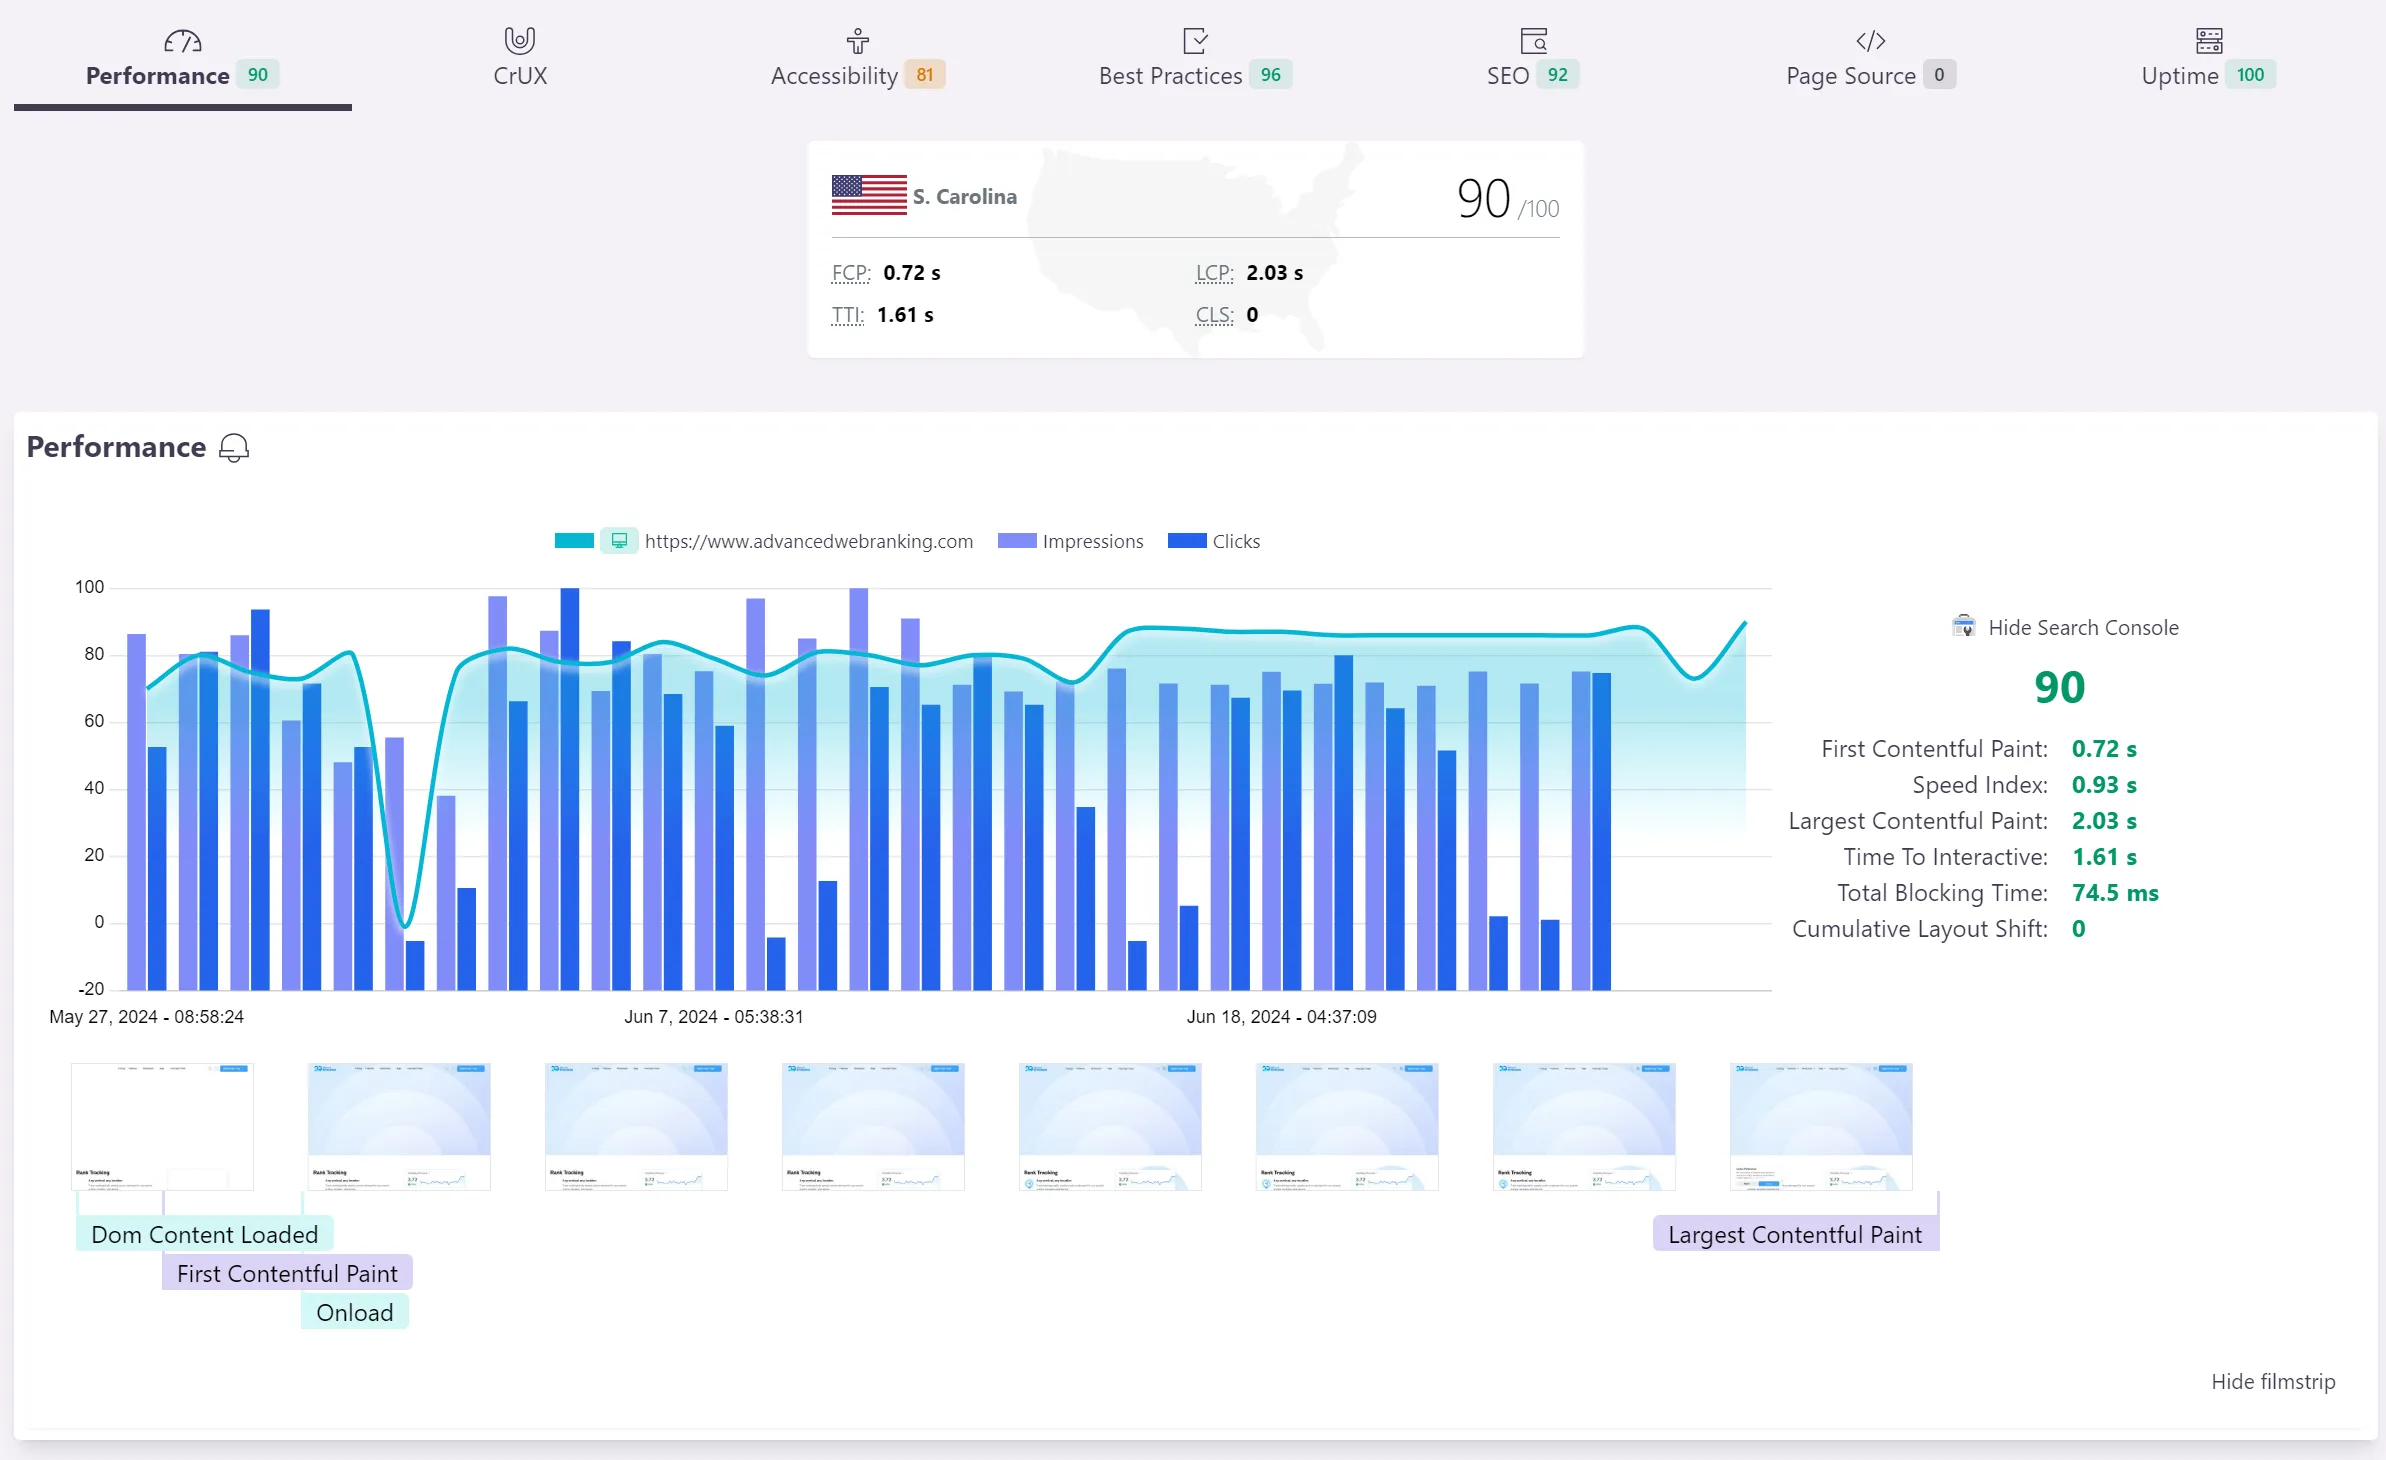
Meant to tell you how a webpage performed over time, the History report is the place where you can find details about each metric's performance.
Performance
If you monitor your webpage from multiple places, you can switch the performance metrics based on desired location. The performance view of History will display the most important Lighthouse metrics in time.

CrUX
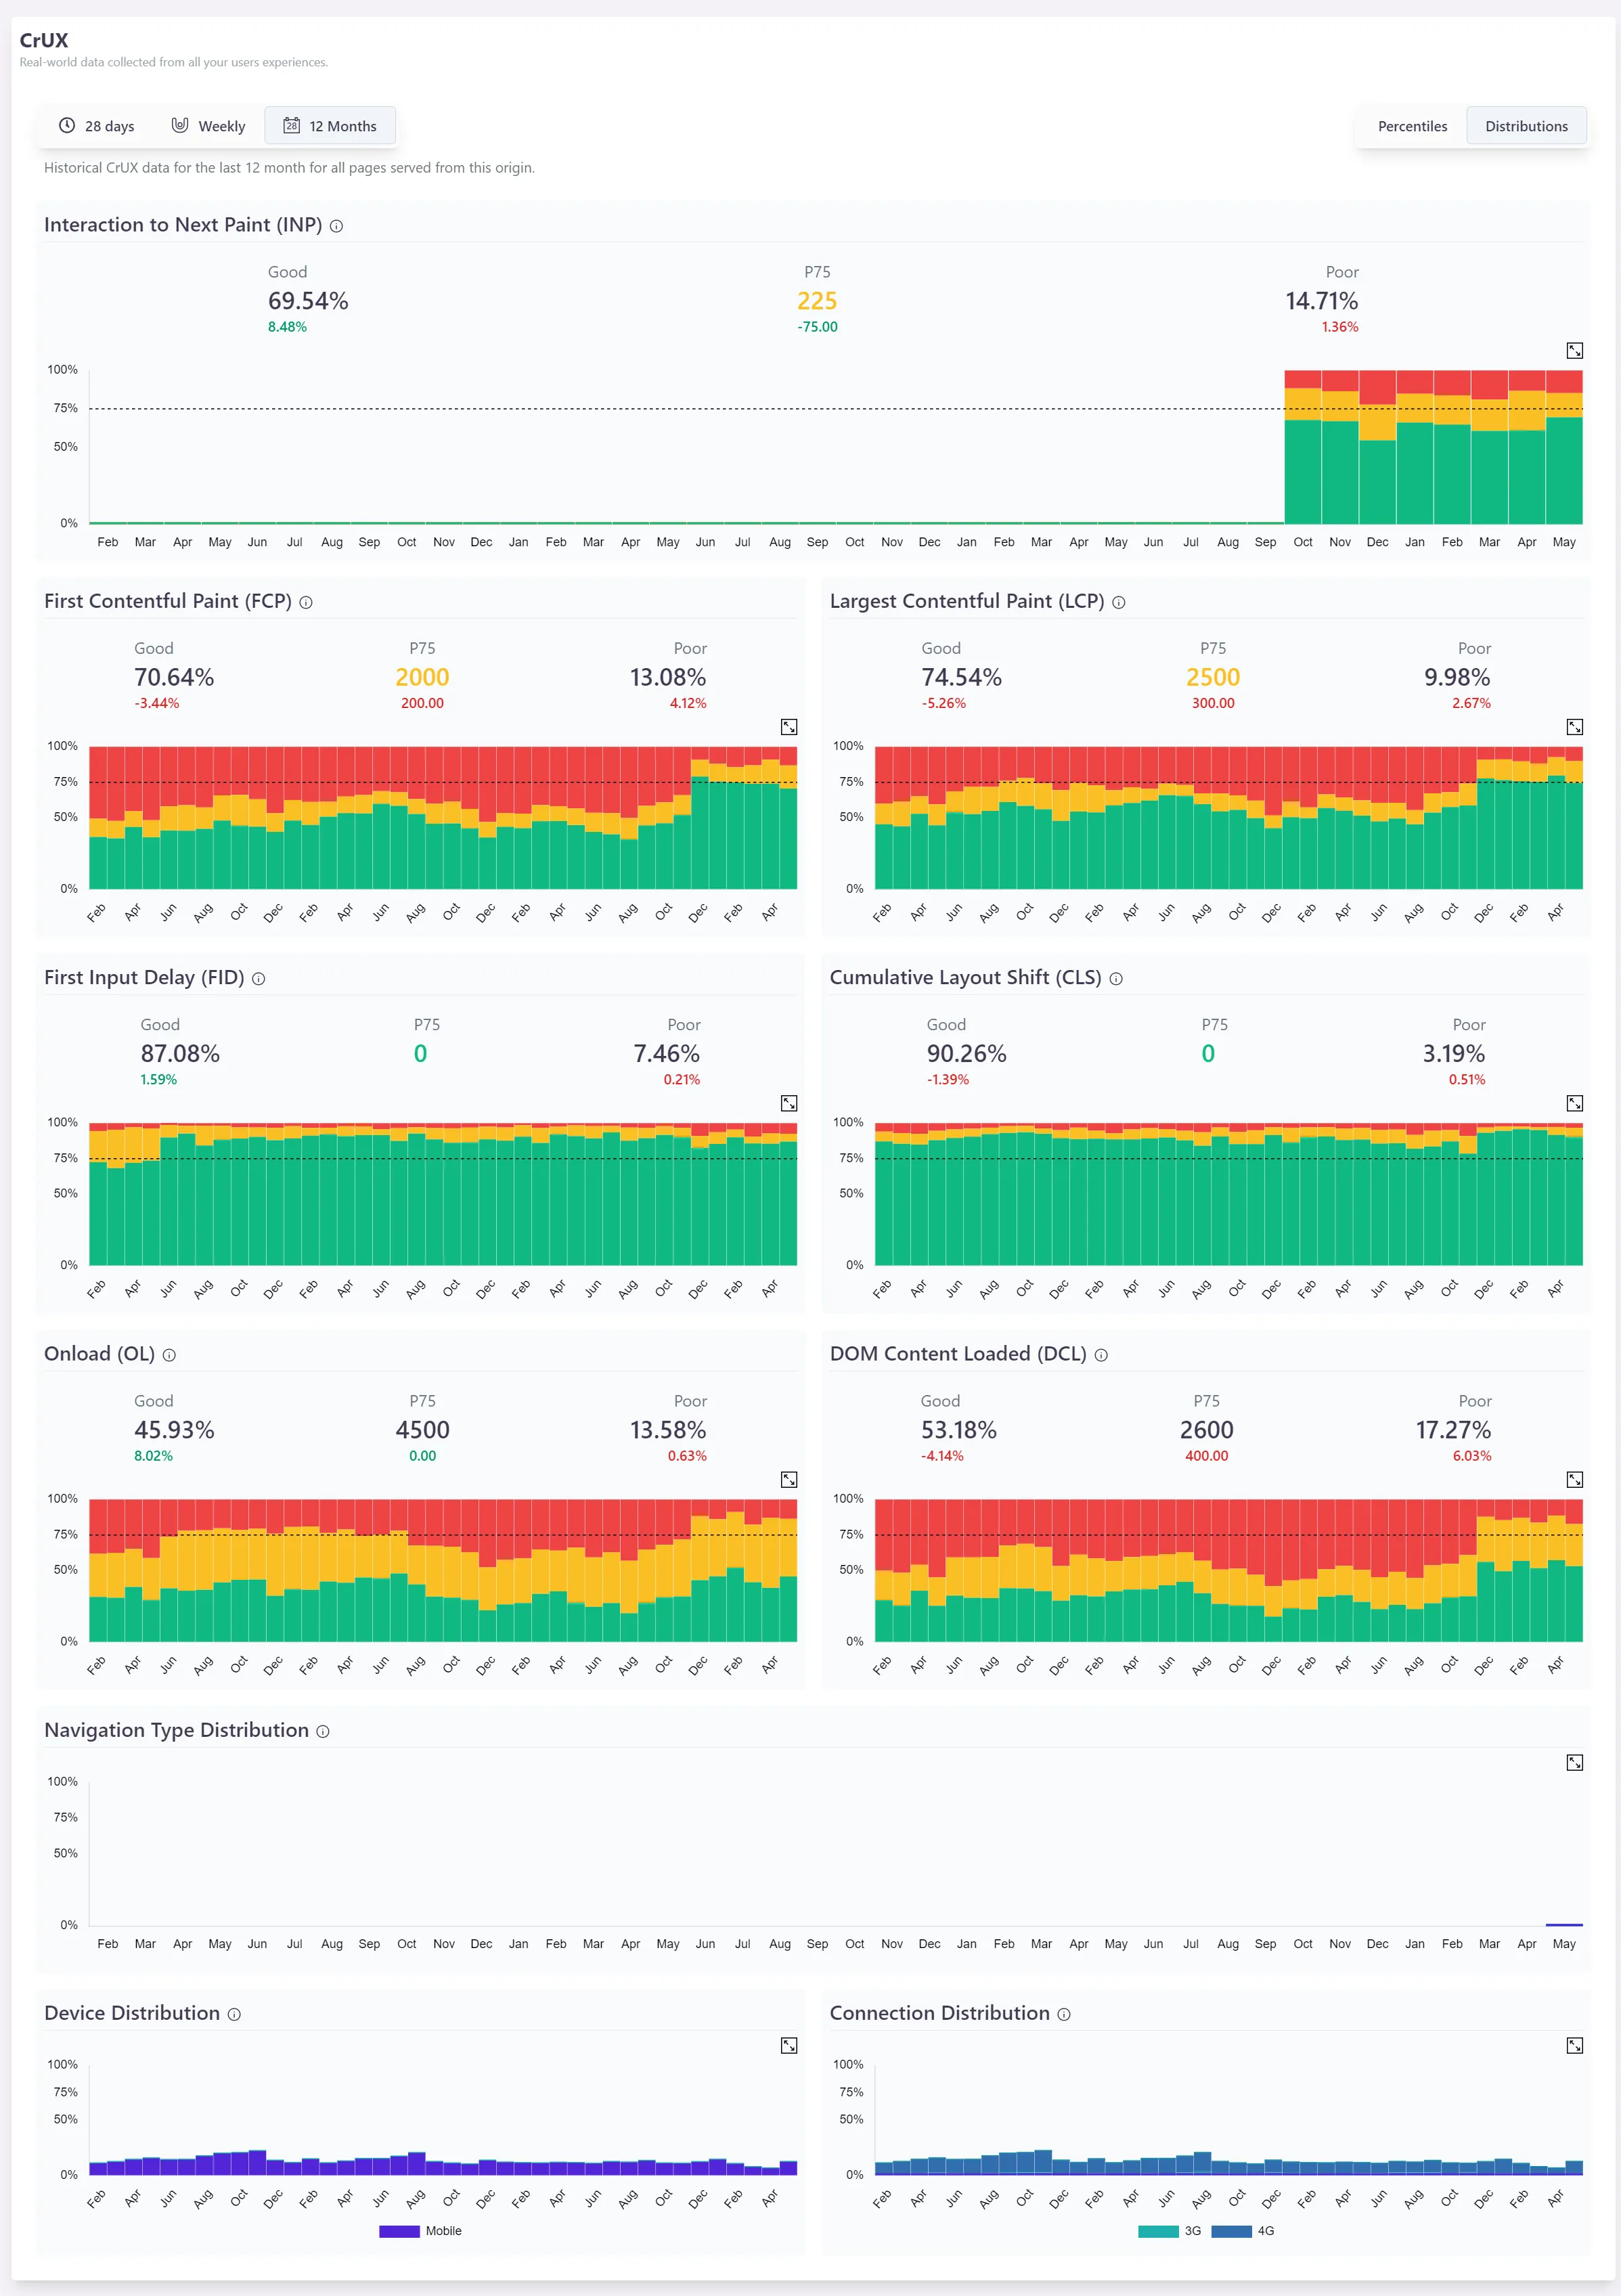
The Chrome User Experience Report (CrUX) provides metrics about how real-world Chrome users experience your website.
While the data is gathered directly from real users for the last 12 month, the CrUX data is basically a transposition of Lighthouse metrics in a real world scenario. Also, each chart contains the 75th percentile, so it is easy to see how much you need to work in order to pass CWV.
In some cases, there may not be enough available real user data for your domain. In this case, no credits will be consumed from your resources.
To get the historical CrUX data, be sure to check the checkbox in the snapshot configuration settings.
