Page Source
The Page Source report contains 5 sections:
Score
- Score: Global page source score. Higher being better, it represents an overall mark of how your page looks like, relative to the page source. The weights of the sections that are composing the overall score as are follows:
| Plan | SEO | Performance | Technical |
|---|---|---|---|
| Free | 47% | 36% | 12% |
| Pro | 57% | 31% | 17% |
- Score breakdown: This is the place where you can check the issues that are affecting your score.

Summary
Overall information about your page source:

- Full page screenshot: Clicking the thumbnail will open an overlay with the full page screenshot.
- Document language: The HTML lang attribute is used to identify the actual language of text content on a web page.
- Title: The number of characters in title. It is recommended to have 30-60 chars.
- Description: The number of characters present in the description. It is recommended to have 50-160 chars.
- DOM Size: Number of nodes found on your page. It is recommended to have under 1400.
- HTML elements: Number of distinct HTML elements. An average web page uses 32 different HTML elements according to Advanced Web Ranking's HTML study.
- Indexability: the number of issues that prevent the search engines from properly crawling and indexing your pages.
- Mixed Content: Refers to a page where the initial HTML content is loaded over a secure HTTPS connection, but the other resources are then loaded into the page over an insecure HTTP connection.
- Canonical URL: The canonical URL element helps you prevent duplicate content issues in SEO by specifying the "canonical" or "preferred" version of a web page.
- Links: Number of total and broken links. The links are also represented by a chart that counts the external, internal and follow relations.
- Keywords: The number of total keywords found and the most frequent used with the percent number relative to the all content in page.
- Resources: Size and load time with the 4 most met resources types.
- Grammar: The number of grammar issues.
- HTML validation: Number of issues split by errors and warnings.
SERP and Social preview
Find out how search engines and social networks display your page. 
SEO
- Title and Description: includes the favicon and the title with the errors found and counter of characters and words.
 You can filter by internal/external, unique or broken and search for a specific link. If you feel like you want to track in time one URL, simply use the plus button to monitor it.
 - Indexability: a list of issues that prevent the search engines from properly crawling and indexing your pages.

- Headings: the h1–h6 elements represent six levels of section headings, with h1 being the highest section level and h6 the lowest.

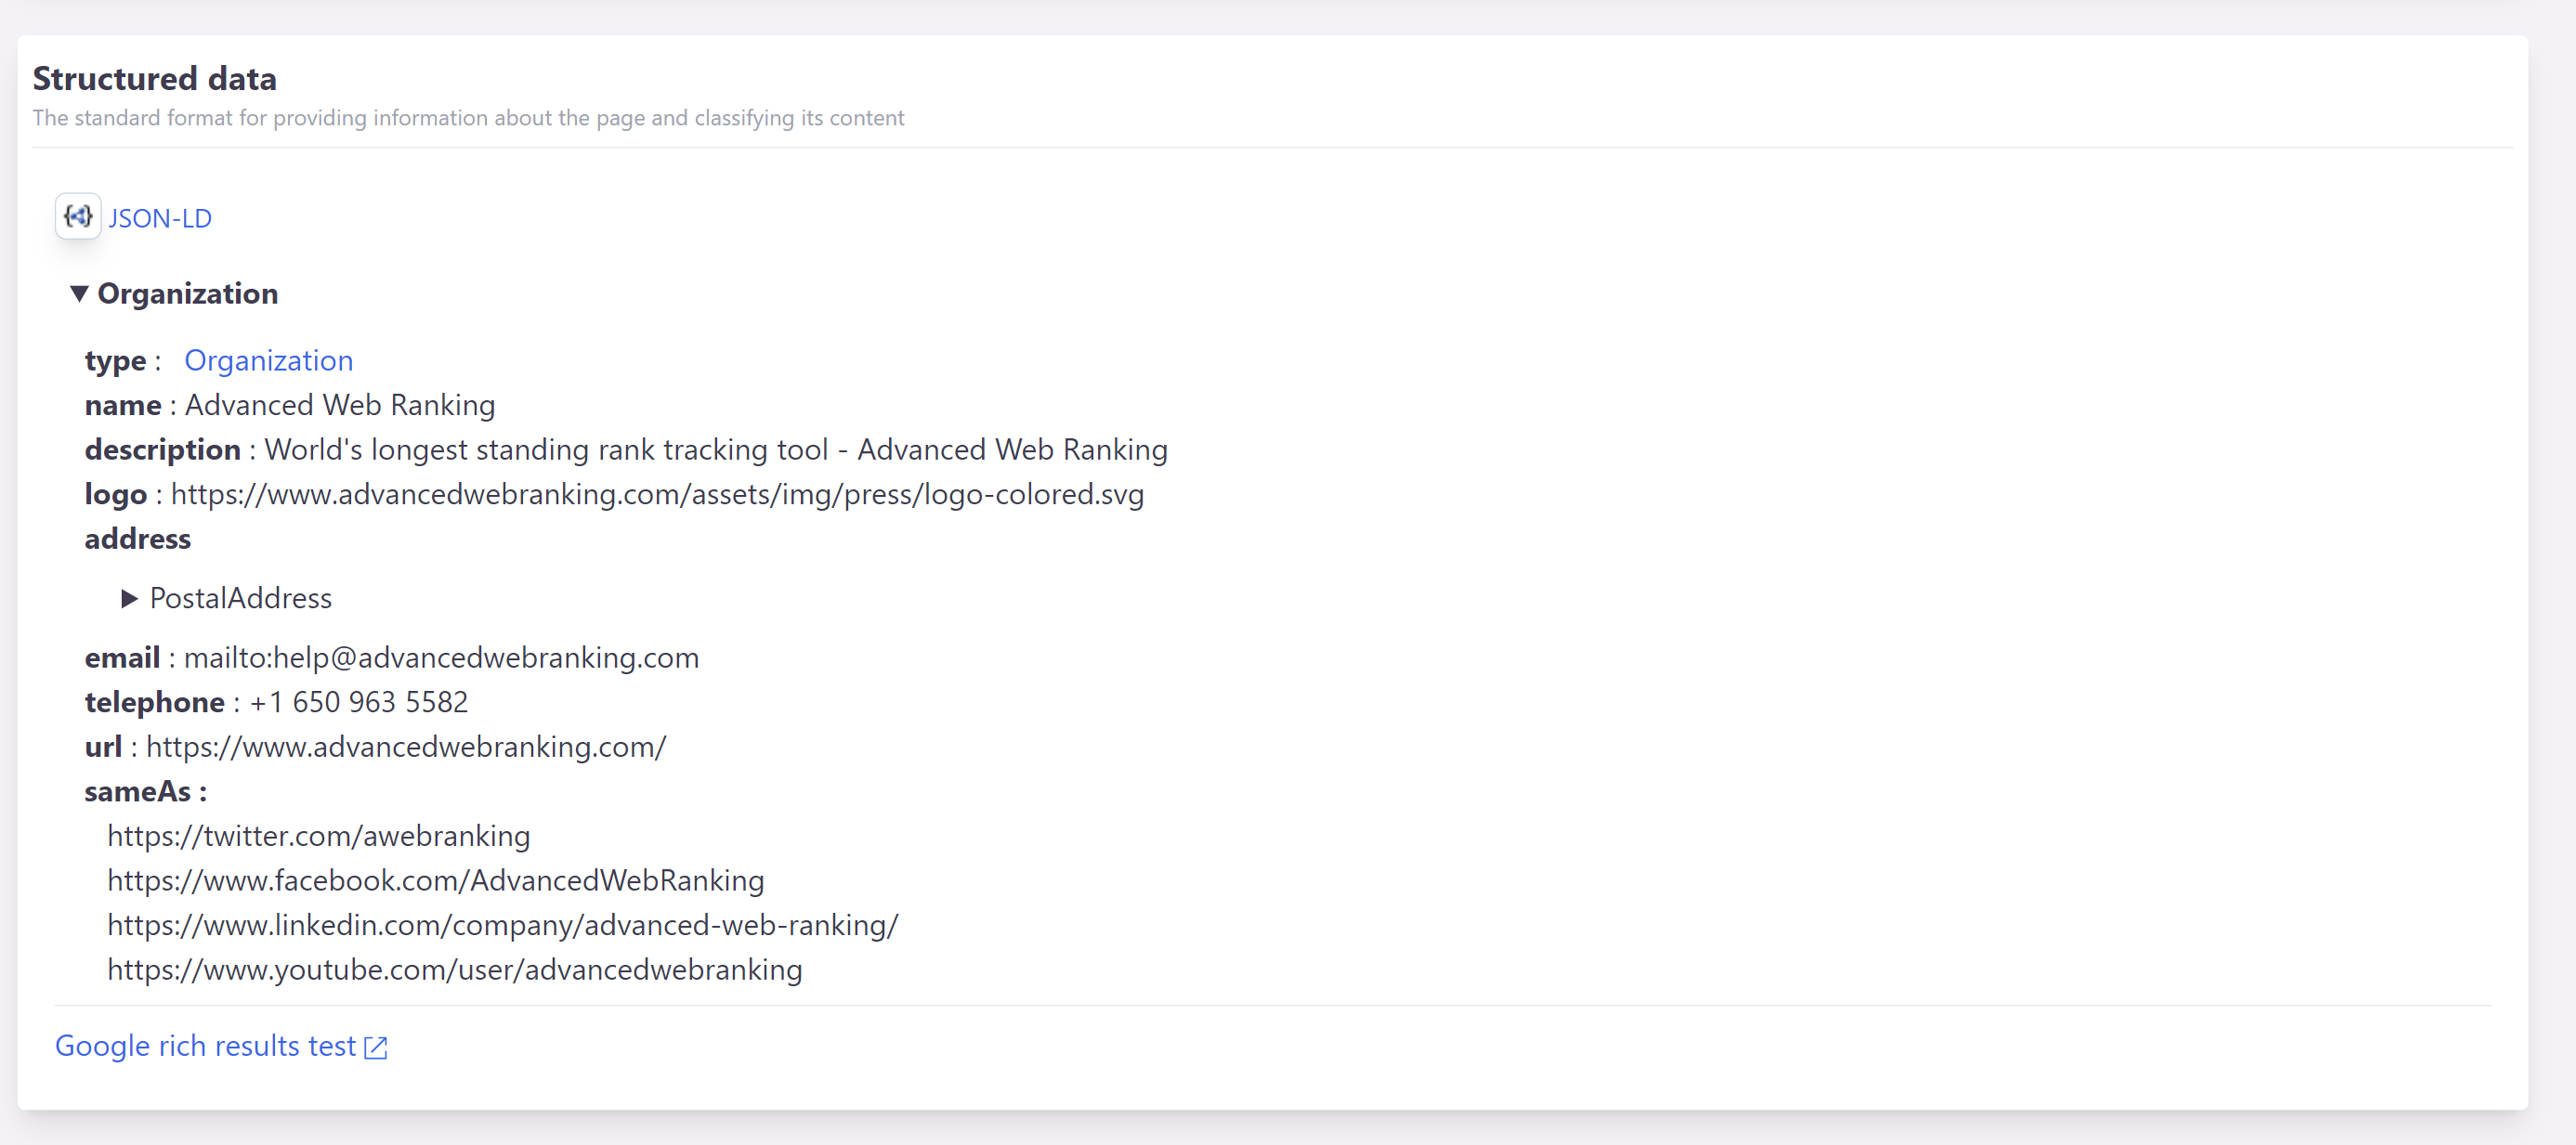
- Structured data: The standard format for providing information about the page and classifying its content.
- Links: includes internal and external links, broken links, and unique links found within your page.
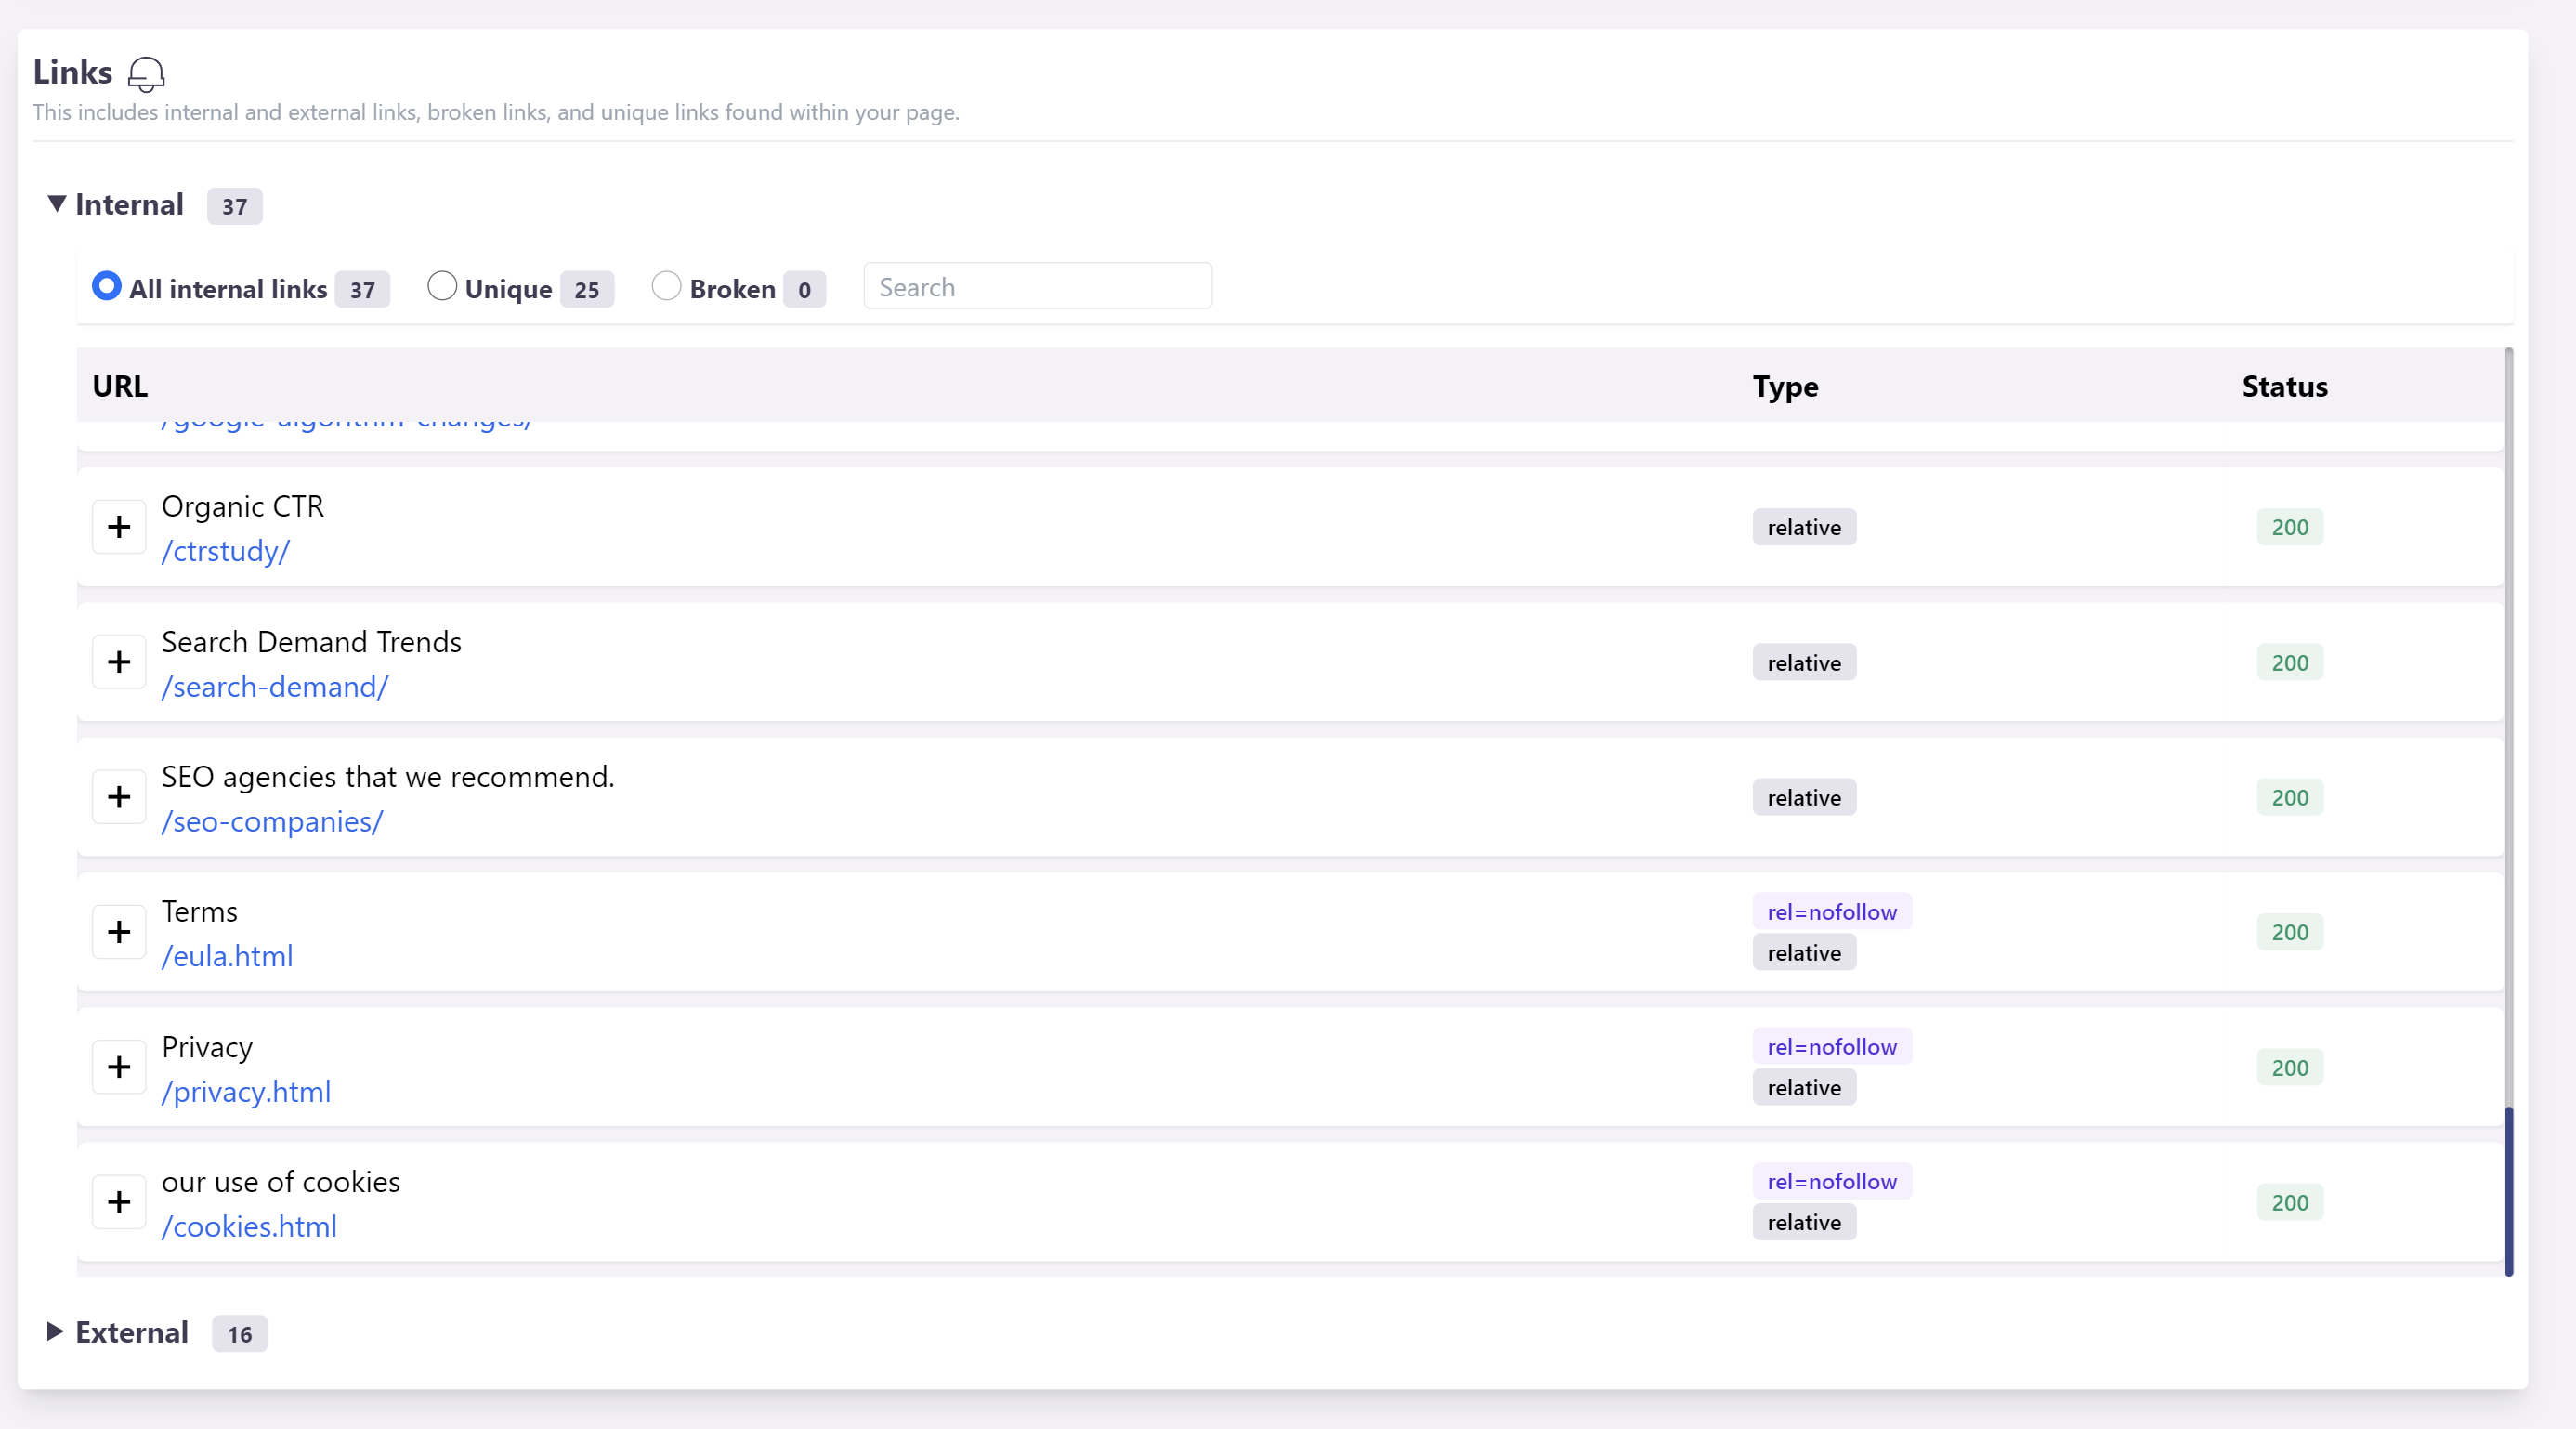 You can filter by internal/external, unique or broken and search for a specific link. If you feel like you want to track in time one URL, simply use the plus button to monitor it.
Content
- Keywords: a table with possible keywords with the columns of counts found in Title, URL, Meta, Content, a density column and a relevance score represented in colored stars.
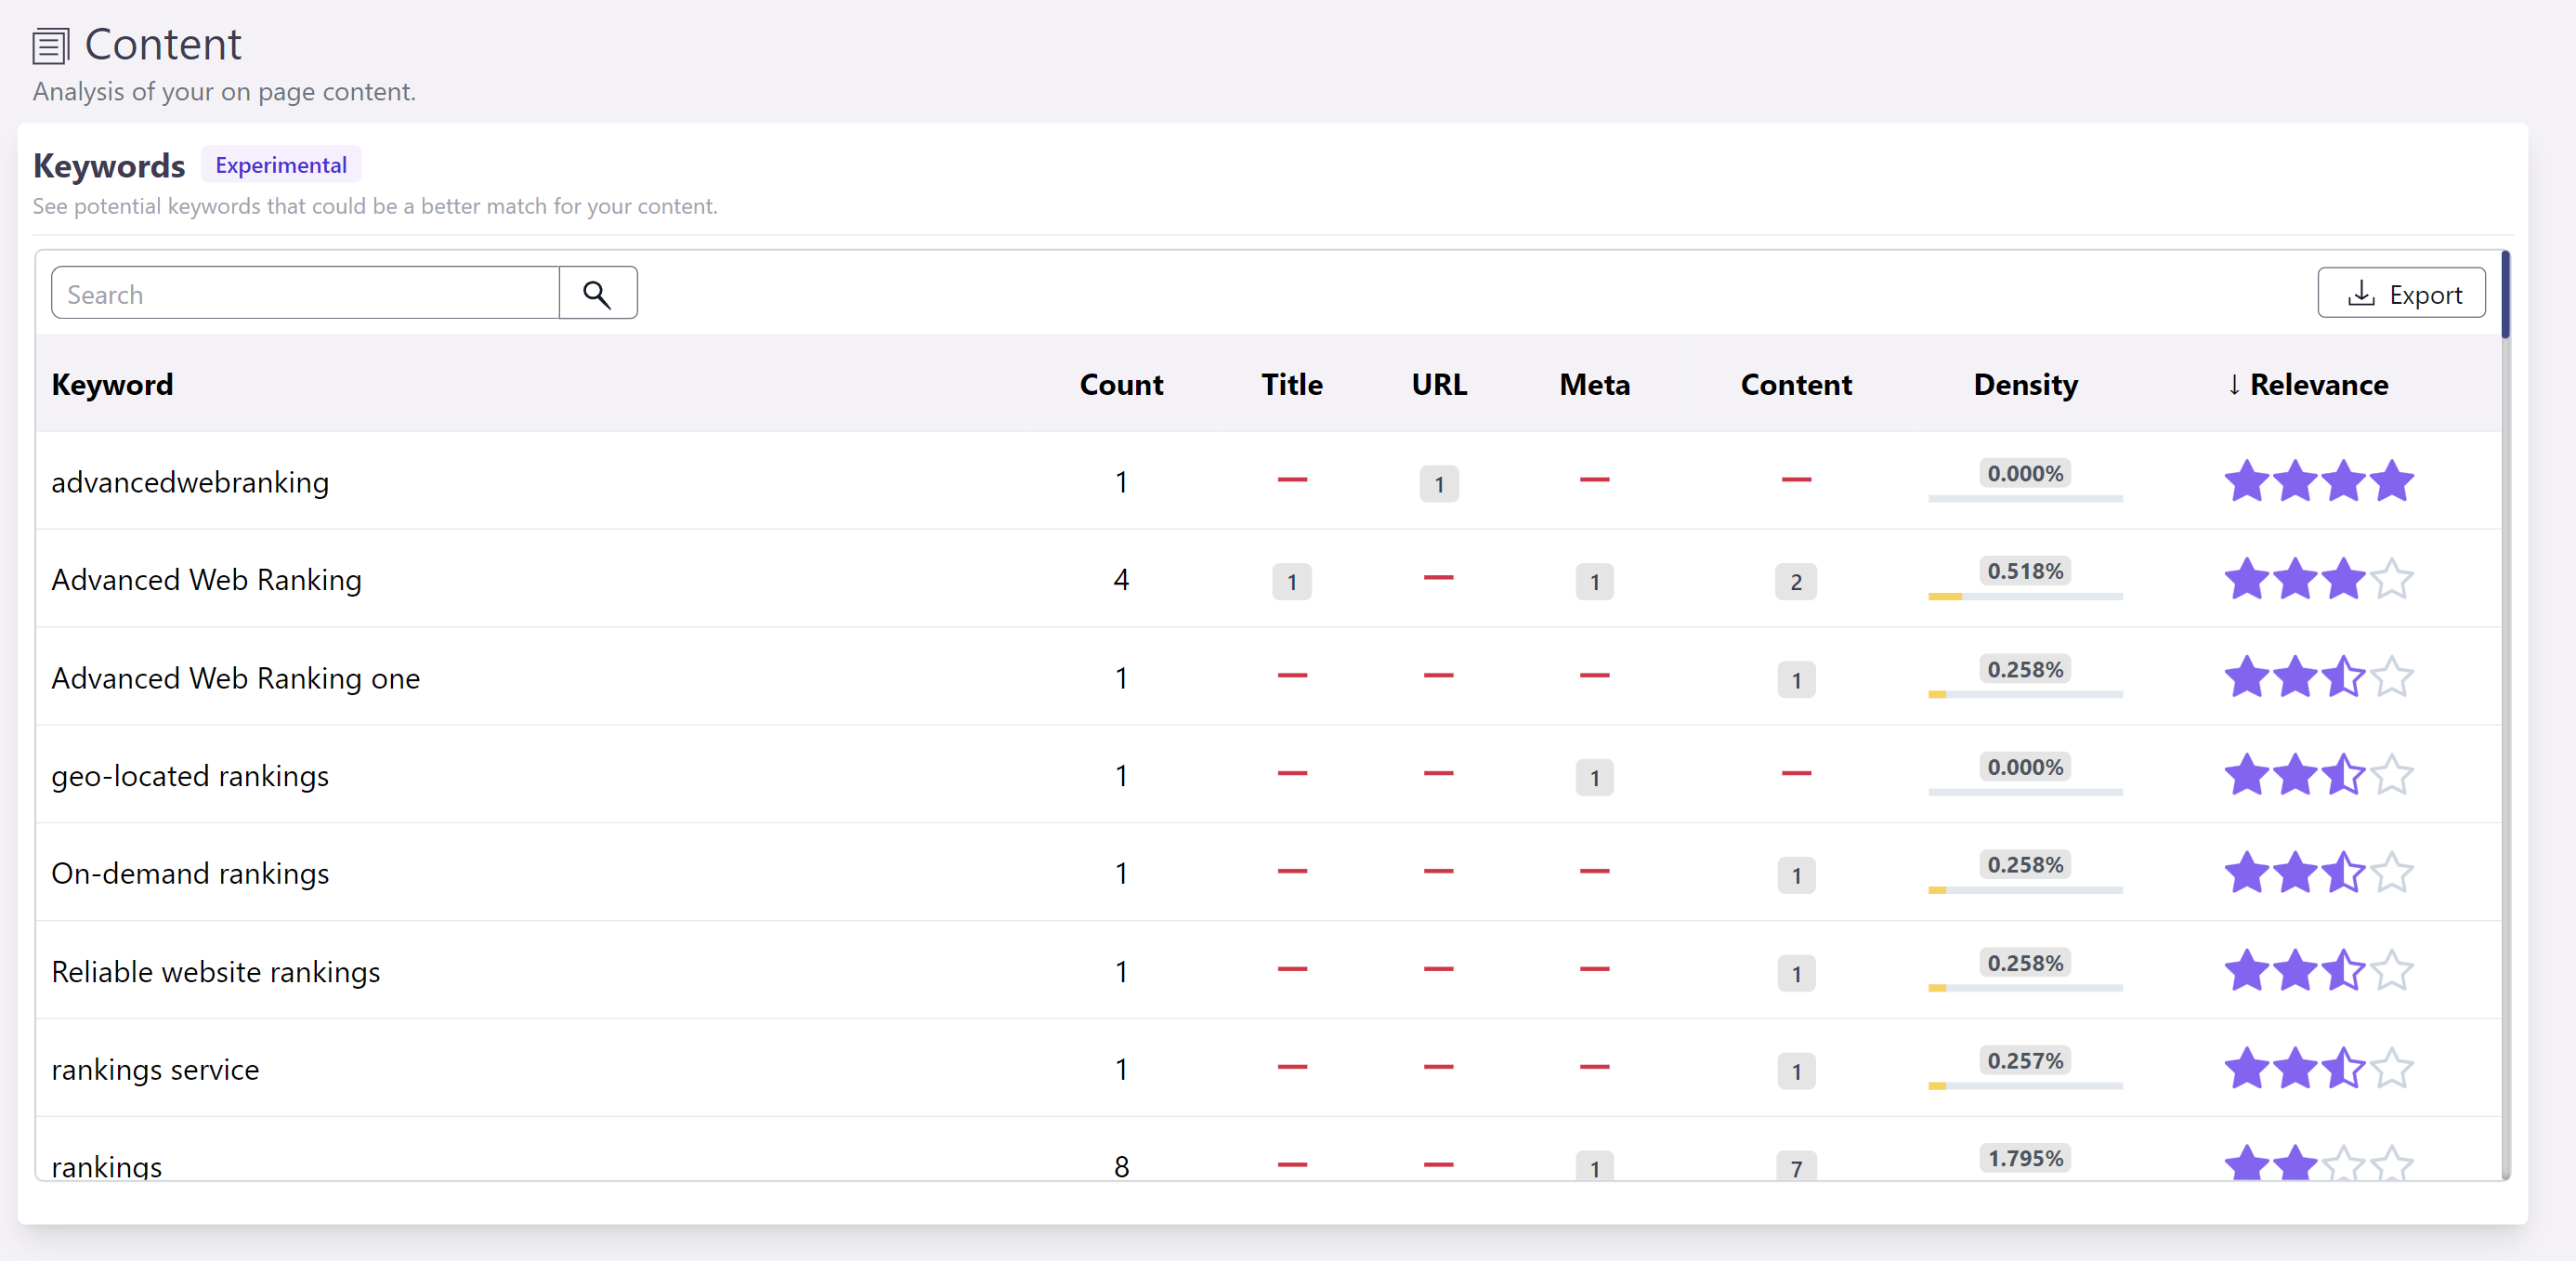 You can search a for keywords, sort by clicking on columns and export the tabel in a .csv file.
 - Grammar Check: a list of issues found with a detailed section for the selected issue.

Technical
- Requests: section provides a detailed view of all the resource requests made by a webpage. This tool helps in identifying anomalies, and optimizing the load time of a webpage.
The interface is divided into several sections:
Control buttons
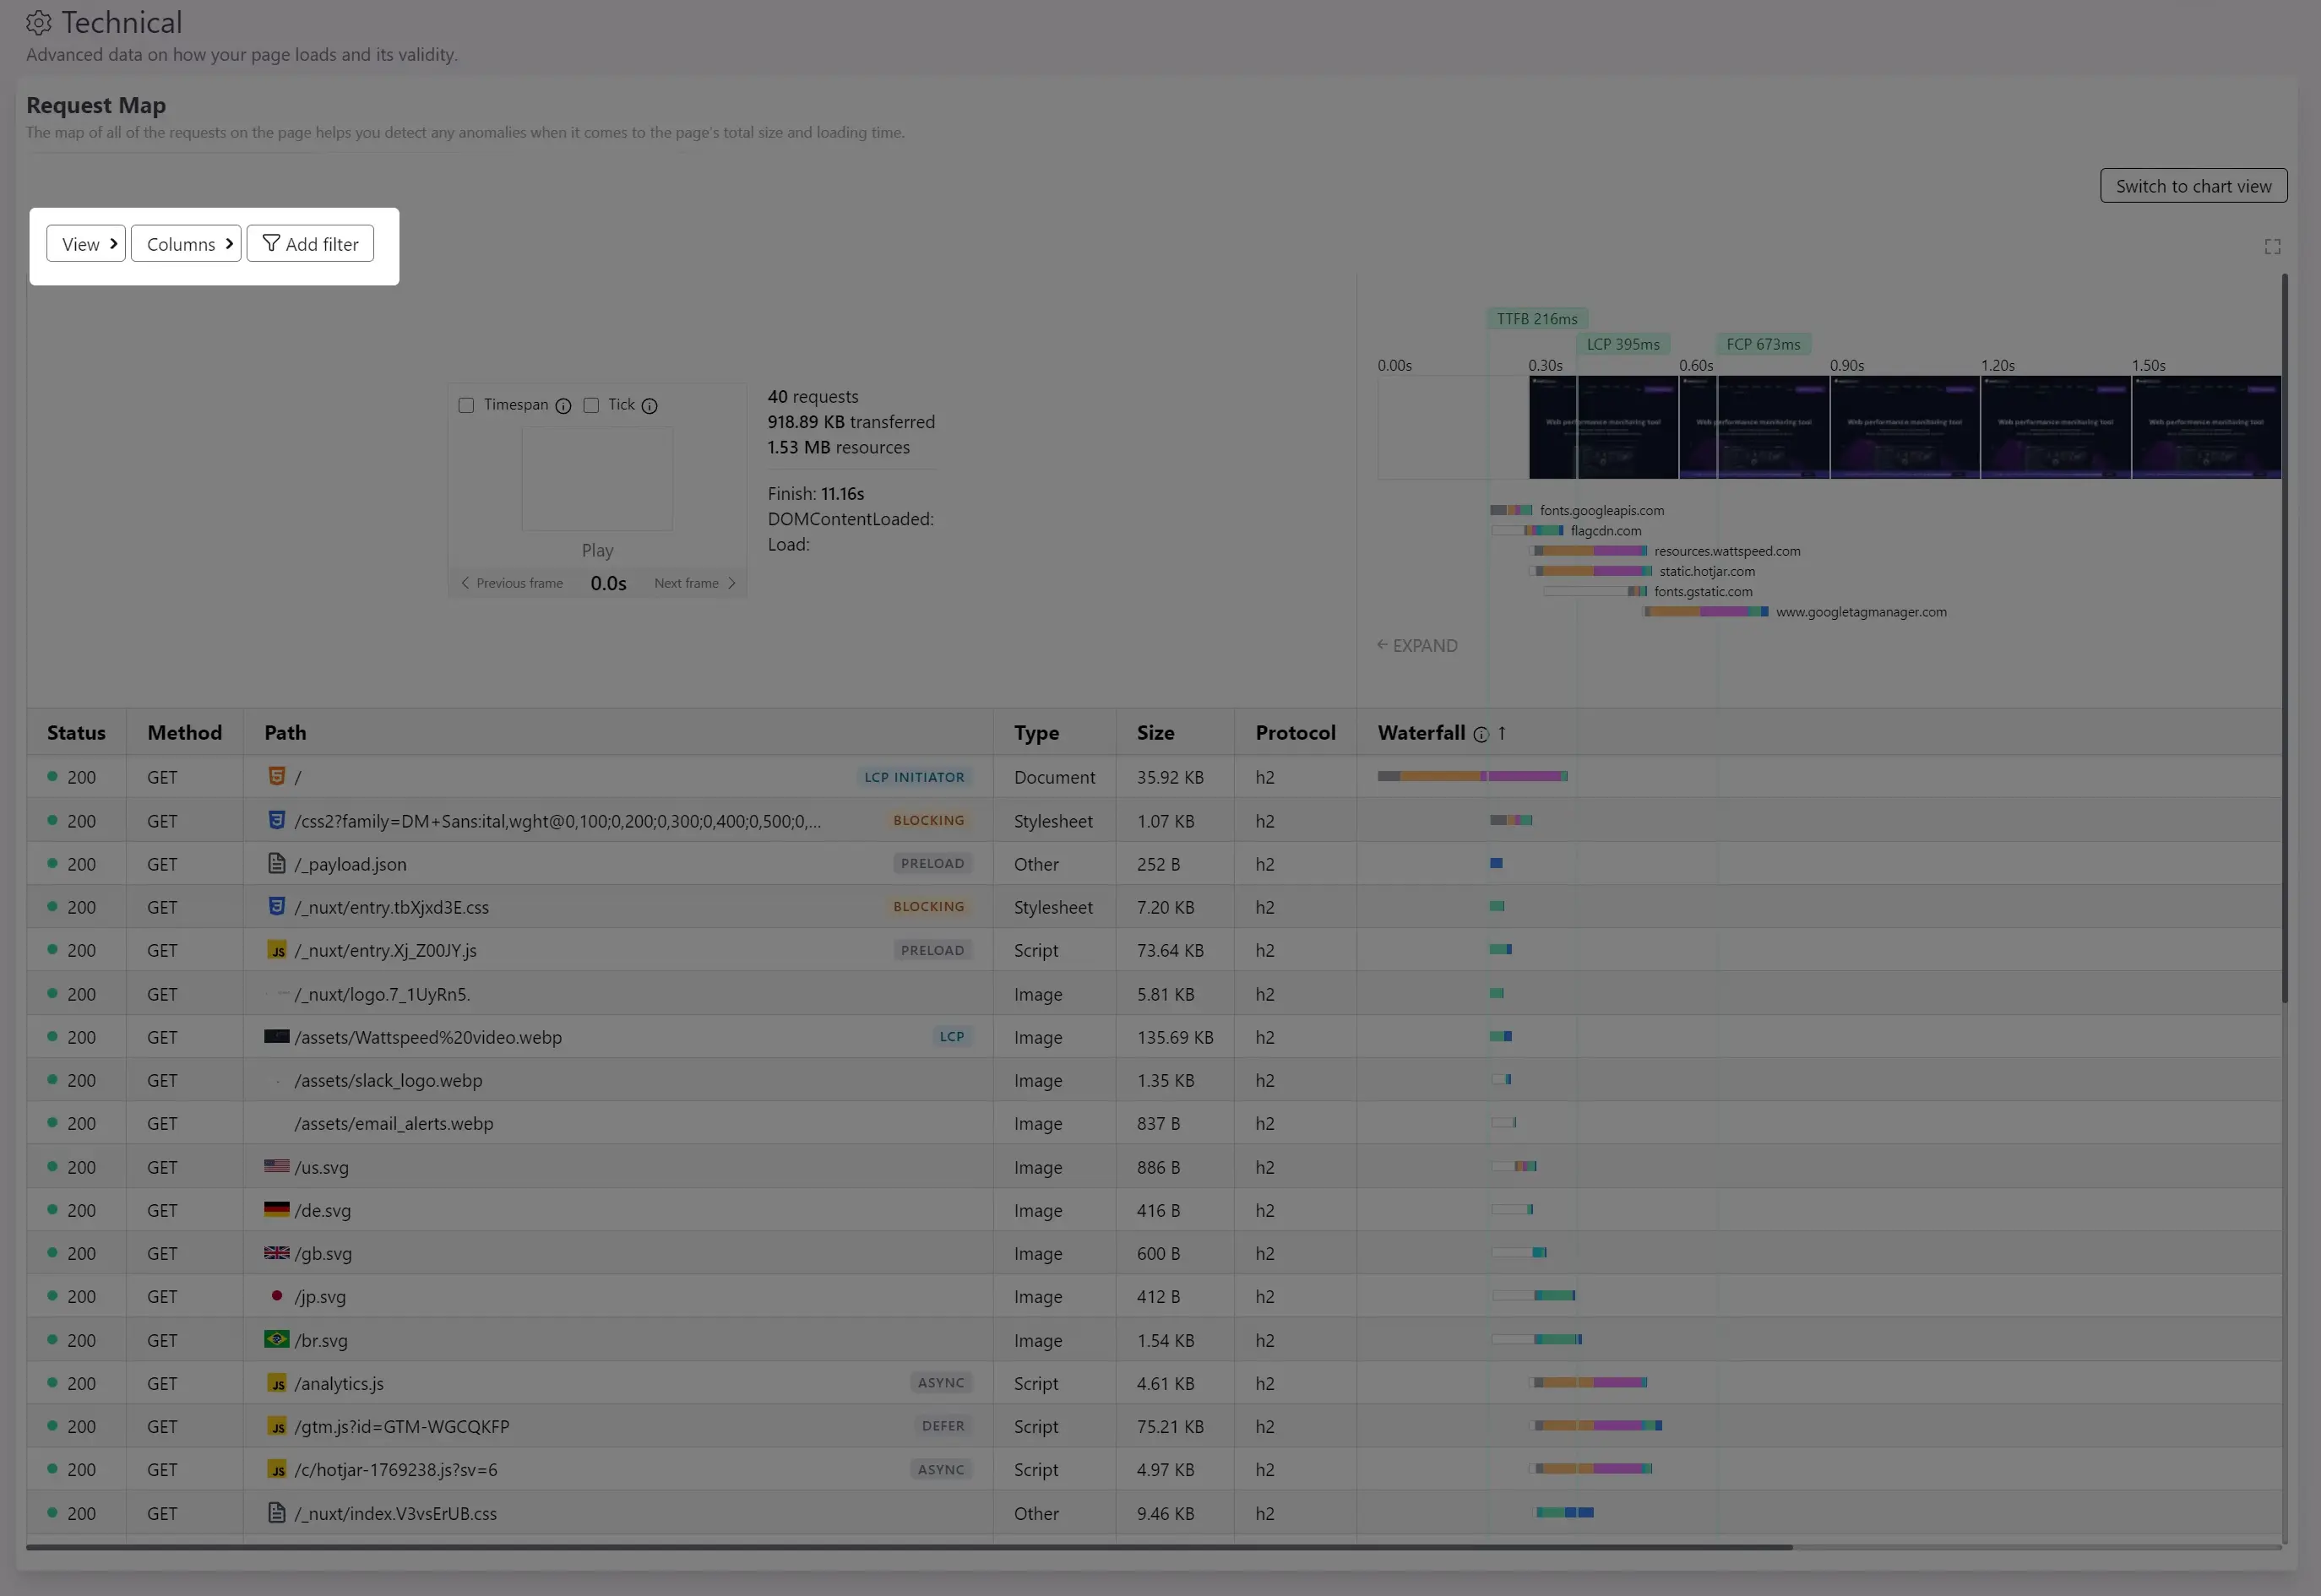
- View - Provides 2 options:
- Compact view This toggle option will make the table more compact by removing whitespaces and reducing the text size.
- Wide Waterfall This toggle will keep only the 'Path' and 'Waterfall' columns for a better visualization of waterfall.
- Columns - This button will show a dropdown with toggles (to show or hide) for each column in table.
- Add filter - Allows you to filter the displayed requests based on different categories like: domain, request type, request status, is internal or external resource, etc.
Filmstrip player
The filmstrip player provides a visual representation of the page loading process.
- Play/Pause: Control the playback of the loading sequence.
- Previous/Next Frame: Navigate between frames of the filmstrip.
- Timespan Checkbox: When checked, only requests made up to the selected frame's timing are displayed in the table.
- Tick Checkbox: When checked, will display only requests included in the selected frame.
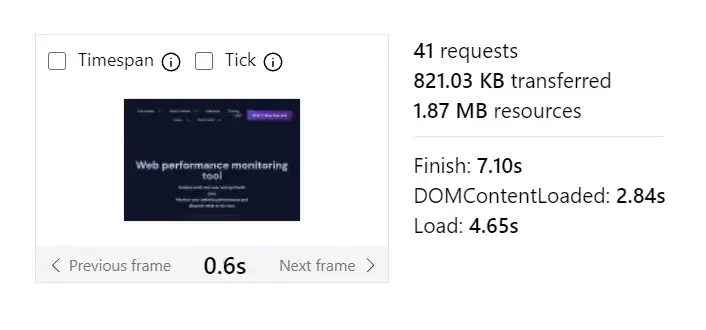
Timeline screenshots with performance metrics
Displays the sequence of screenshots taken during the page load at intervals of 300ms.
Below the filmstrip, colored bars represent the average timing breakdown of each domain involved in loading resources on the webpage.

Above the filmstrip, are displayed some metrics:
- TTFB (Time to First Byte): Time required to receive the first byte of the response.
- LCP (Largest Contentful Paint): The time required for the largest element of content to be painted on the screen.
- FCP (First Contentful Paint): The time required for the first element of content to be painted on the screen.
- DOM Content Loaded: The time required for the HTML document to be fully loaded and parsed, without waiting for stylesheets, images, and subframes to finish loading.
- Onload: - Onload: Time taken for the webpage to completely load, including all dependent resources such as stylesheets, images, and subframes.
Detailed request table
Lists all the resource requests made by the webpage.
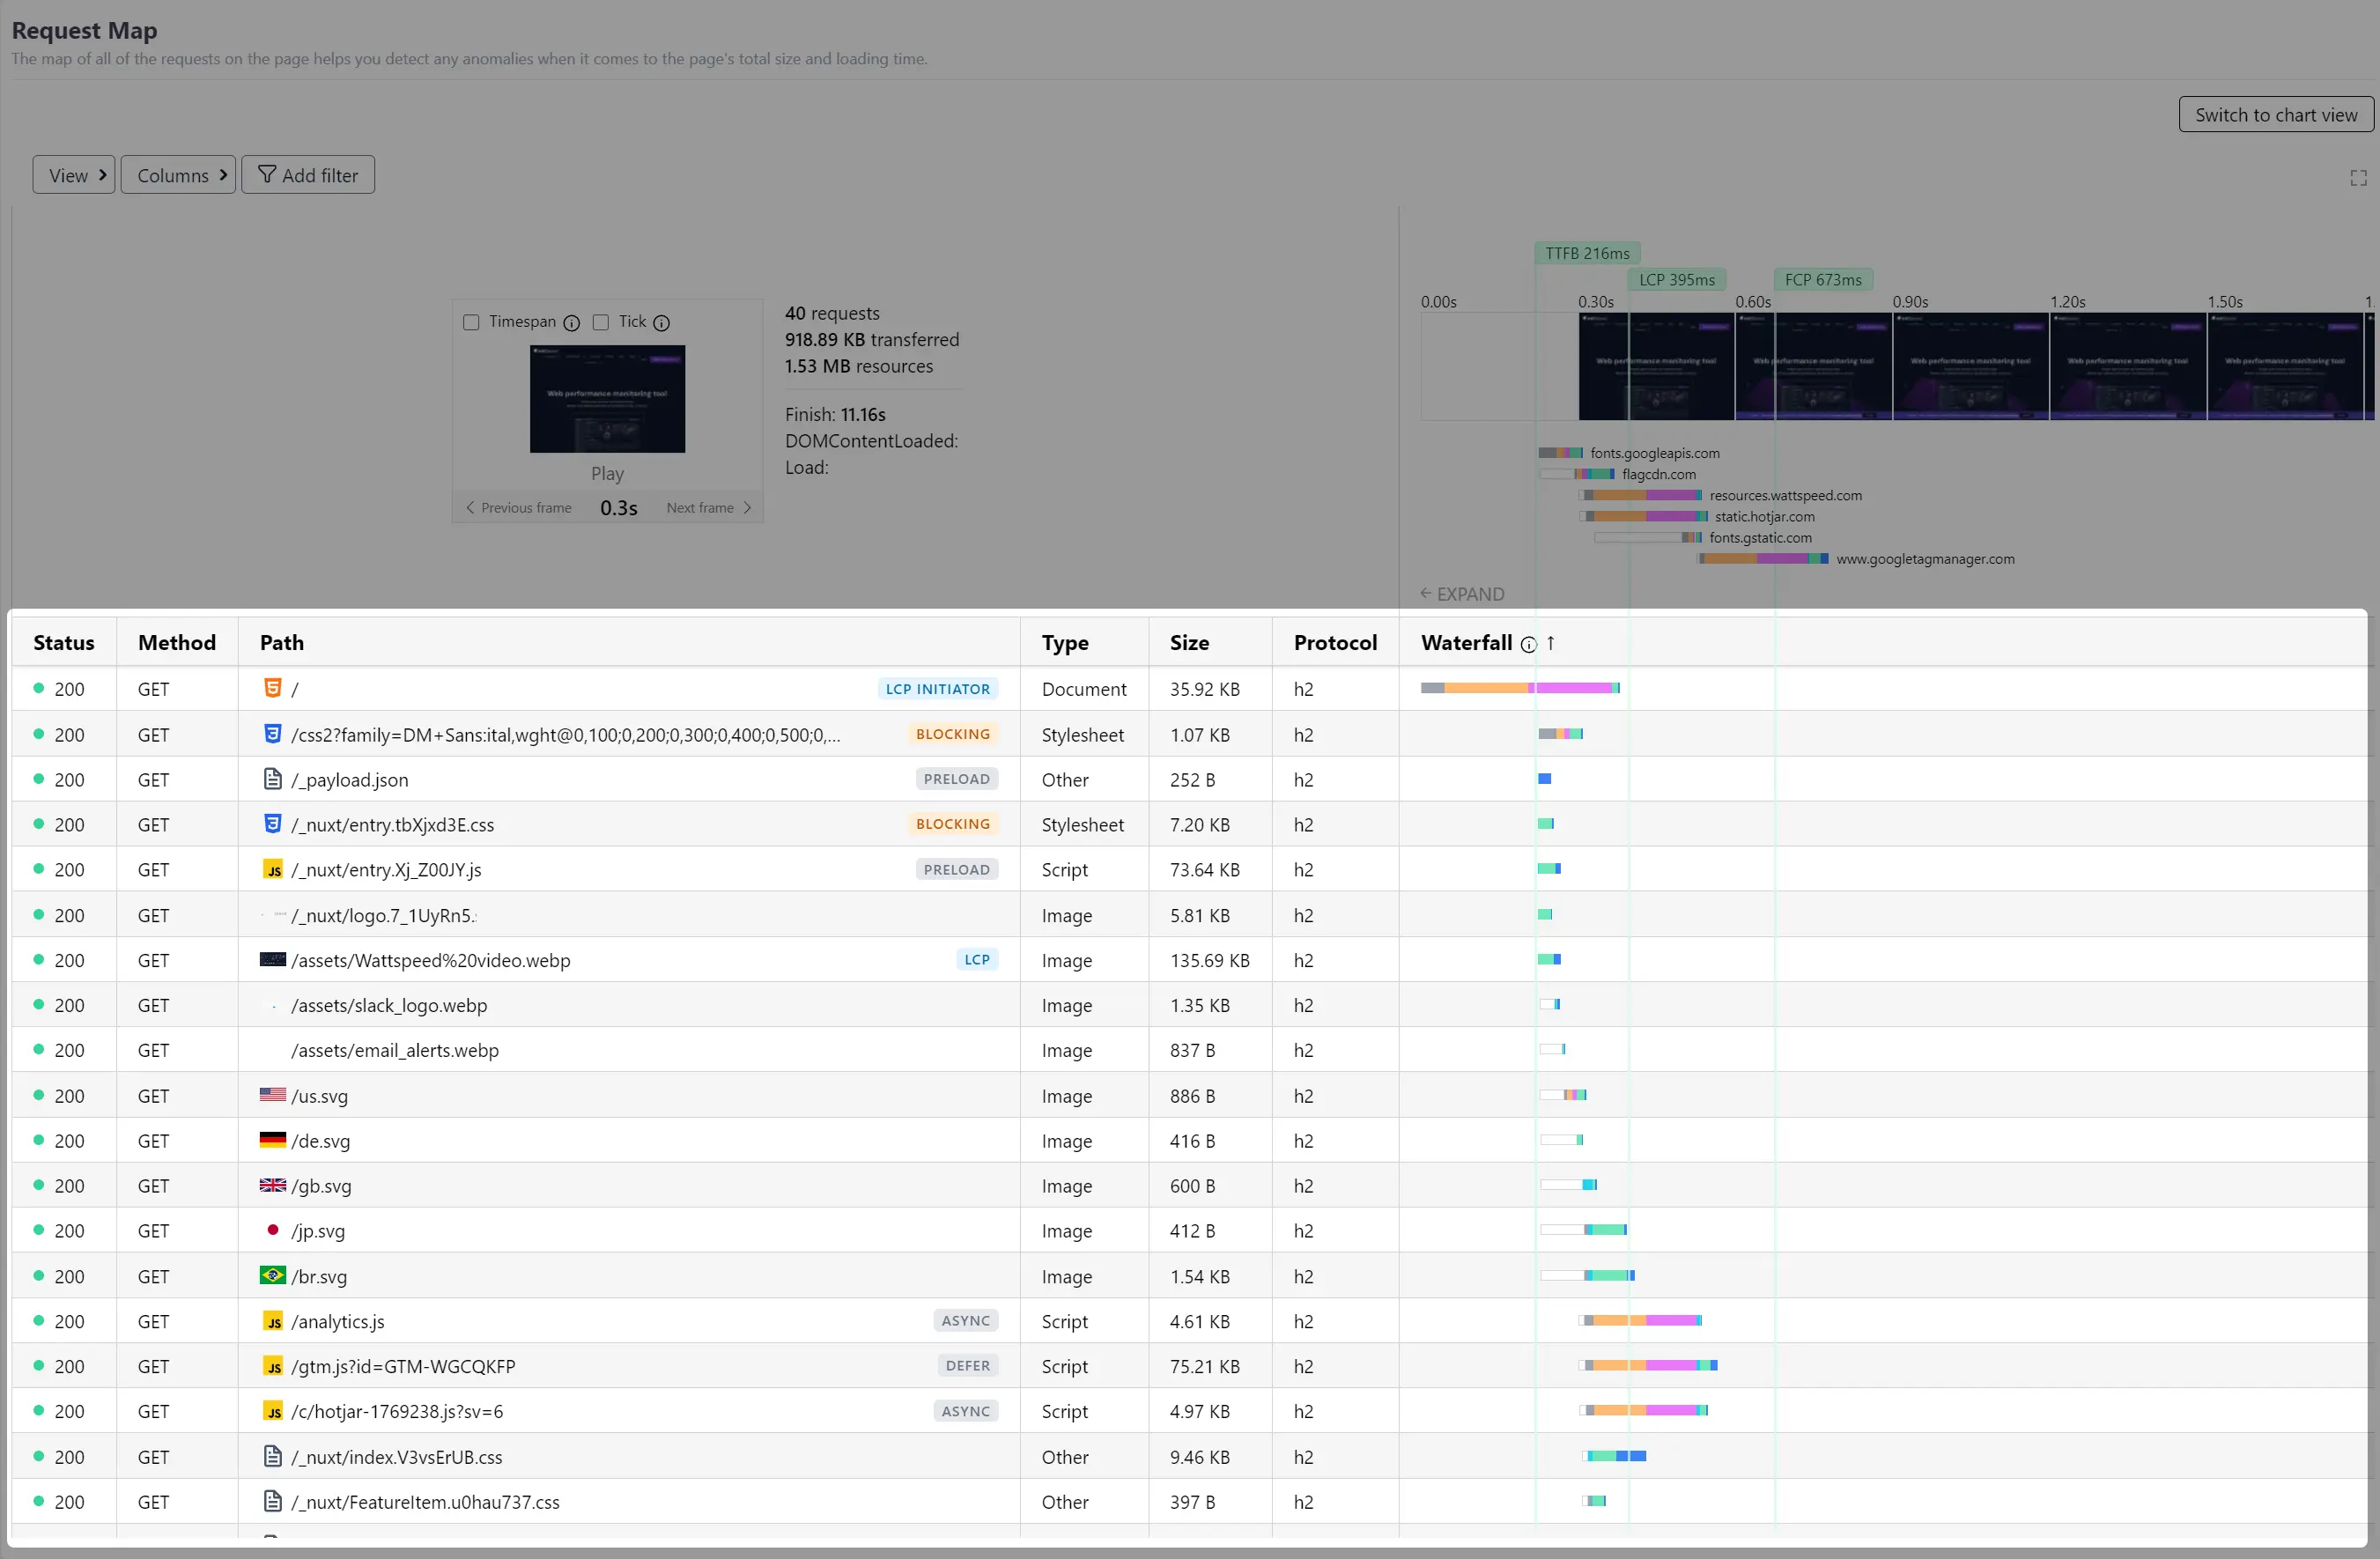
Each column provides specific details about the requests:
- Status: The HTTP status code of the request (e.g., 200, 404).
- Method: The HTTP method used for the request (e.g., GET, POST).
- Path: The URL path of the requested resource.
- Type: The type of the requested resource (e.g., Document, Stylesheet, Script, Image).
- Size: The size of the requested resource.
- Protocol: The protocol used for the request (e.g., h2, http/1.1).
- Waterfall: A visual representation of the request timing breakdown. The bar shows various stages of the request such as queueing, stalled, initial connection, SSL, TTFB, and content download. The position and length of each segment are normalized to reflect the actual timing.
While the chart view will display dimensional data based on time or size.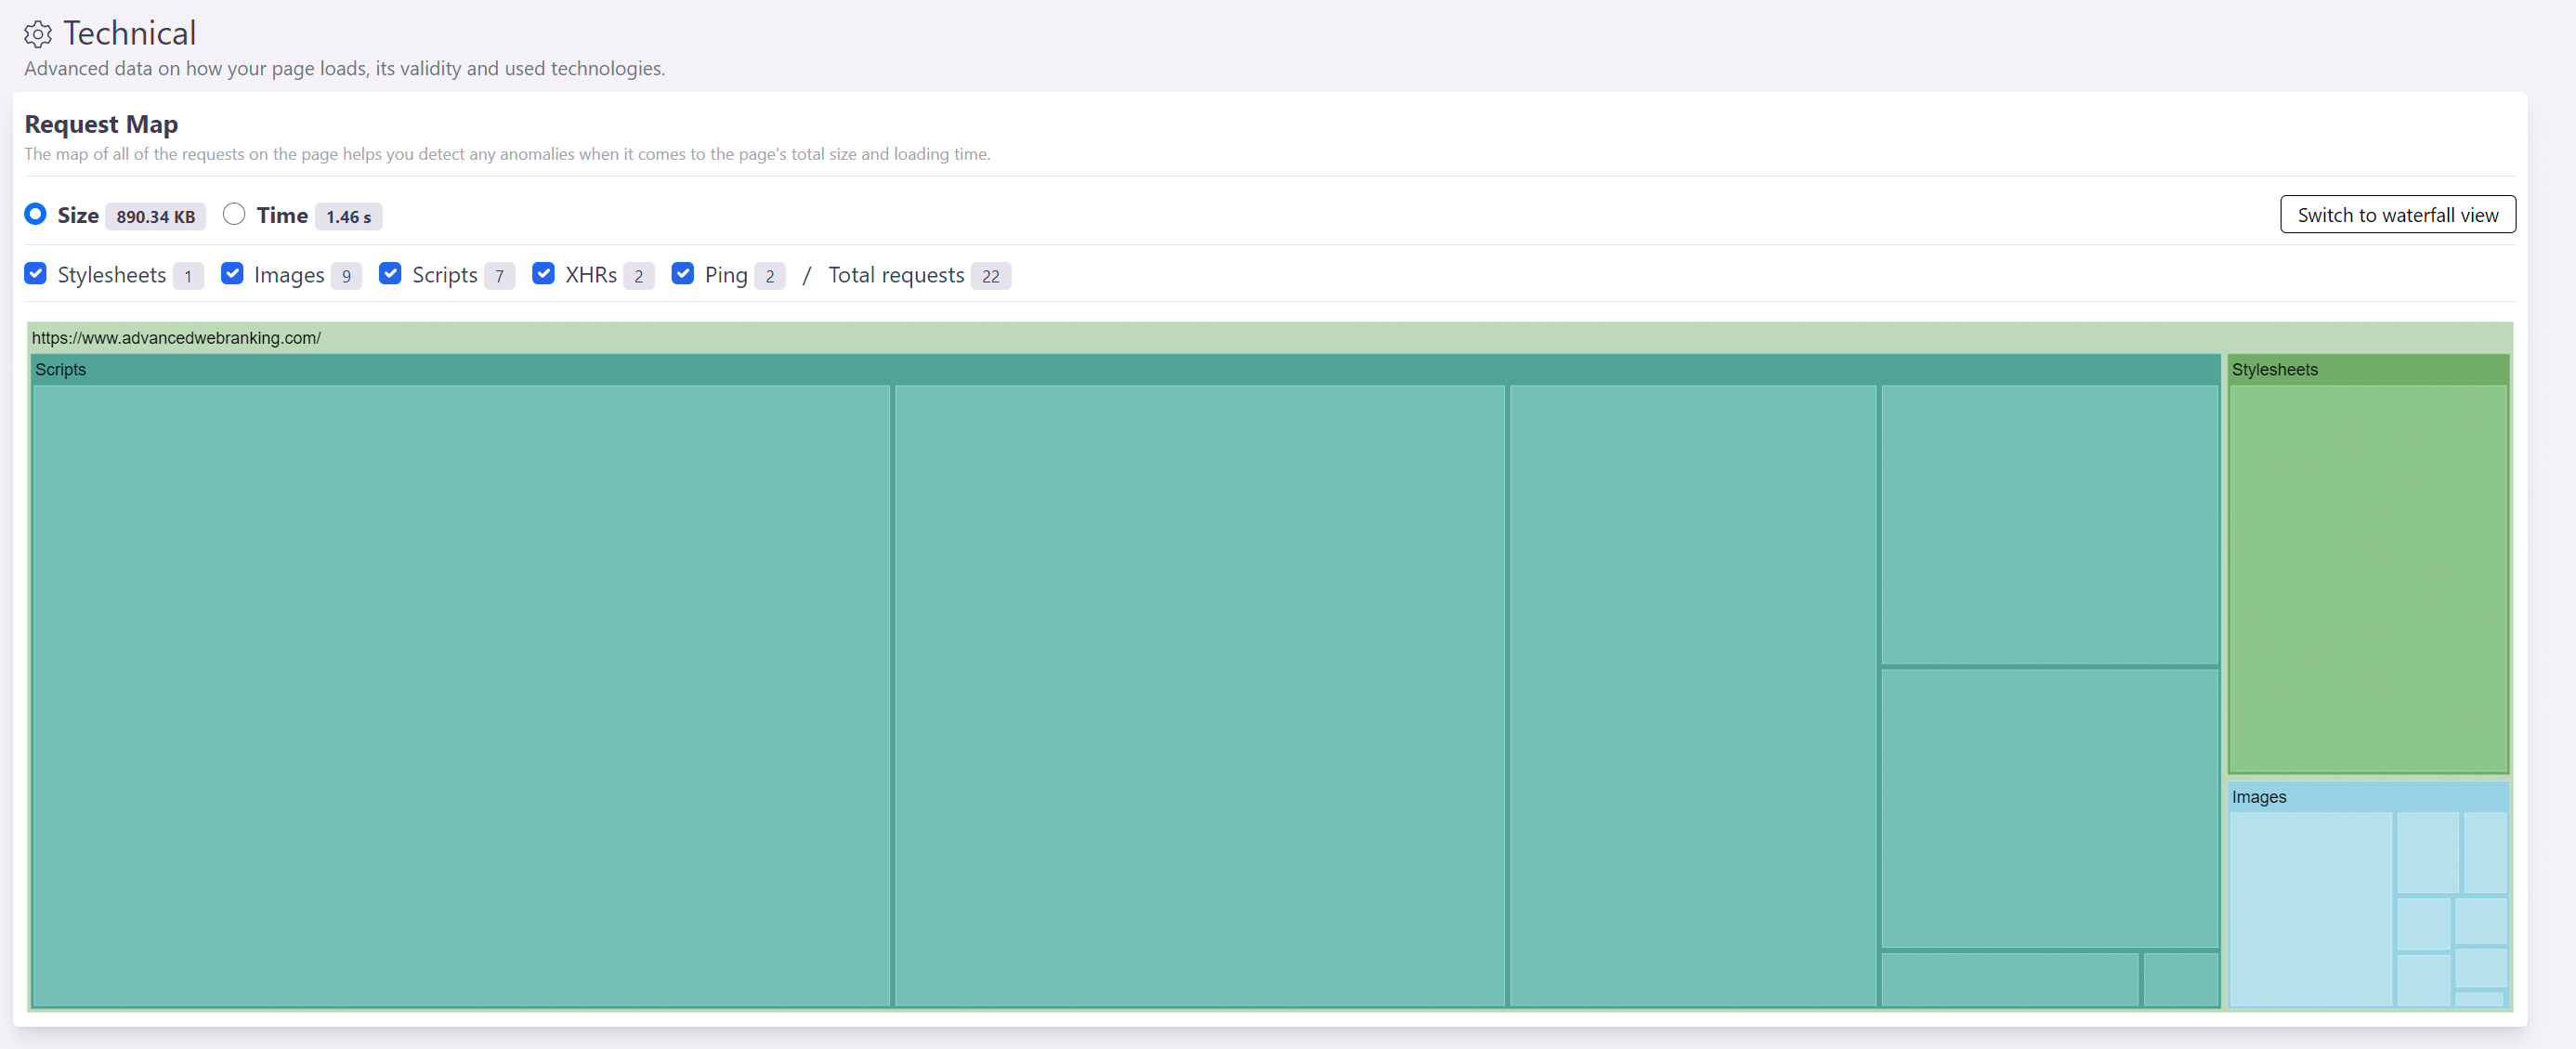
- HTML Validation: Checks the markup validity of a web page and can help you catch unintended mistakes you might have otherwise missed.

Easily add an alert for a metric from above by simply clicking this icon.