
and why there is so much noise around them.
As everyone already knows, a webpage’s loading speed directly affects the visits, conversion rate, and lately the search engine rank.
Available since the web’s existence, web performance optimization (WPO) has continuously developed new techniques and standards, but nowadays we have a set of powerful metrics to measure how a web page is loaded.
What are the Core Web Vitals?
Why do they matter and how to get better scores for them? Let’s find out together in a global language.
Introduced in May 2020 by Google, the CWV quickly became (one of) the most important benchmark in measuring how fast a web page is. It is true, the three metrics found in the Core Web Vitals were there before, but measured synthetically using Google Lighthouse.
The Core Web Vitals is a set of three metrics gathered from real Chrome users that opted in to send anonymous data. So basically, when you load a web page, those three metrics are sent to Google so in the end there will be a huge set of statistics that conclude in the fact that the page meets the CWV requirements in order to be marked as passing CWV or not. This set of data is also called CrUX.
Let’s see what the 3 metrics are about!
LCP (Largest Contentful Paint)
Measures the loading performance.

LCP measures how much time it takes for the largest element on the page to load. It can be an image, a text block, or even a video. It is calculated relative to the time when the page first started loading.
A good LCP is considered below 2.5 seconds.

FID (First Input Delay)
Measures the interactivity.
The time when a user can first interact with your page by clicking a button, a link, or interacting with some JavaScript controls. At that time, the browser is ready to respond to user interactions.

CLS (Cumulative Layout Shift)
Measures the visual stability.

In order to see what’s this about, let’s check some examples.

See how the whole layout is shifted? All that movement related to the viewport size translates into the CLS score.
In the second example, there is almost no shift, each element stays in place between frames.

To see the exact formula on how CLS in calculated, see web.dev
If all those metrics are in good intervals, then your page is passing the Core Web Vitals. It is enough that one metric is out of the good interval for the CWV test to fail.
All metrics are considered at the 75th percentile value in order to gather data from various devices and networks.
What do you do when you access a slow or laggy website? Maybe you try again once or twice, but in the end, you quit. That’s one important reason to have a good score for all the three metrics above, for sure it will affect your visits since they measure different categories: performance, interactivity, and visuals.
As confirmed last year, the Core Web Vitals are now a ranking factor.
If you don’t believe me, take a look at our free ranking – crux correlation tool so you can see that the first 10 results of a Google SERP consist of web pages with better CWV. It may not be the most important fact for Google to rank your website higher, but in time it may become more and more important.
How can I improve my Core Web Vitals?
First of all, if you haven’t done this yet, check your CrUX status in Wattspeed.
If you already have an account, go hit the Snapshot sidebar item so you will see how you were performing in the last 28 days. Note that the Core Web Vitals are provided for both URL and origin, meaning the aggregation of all domain’s webpages.
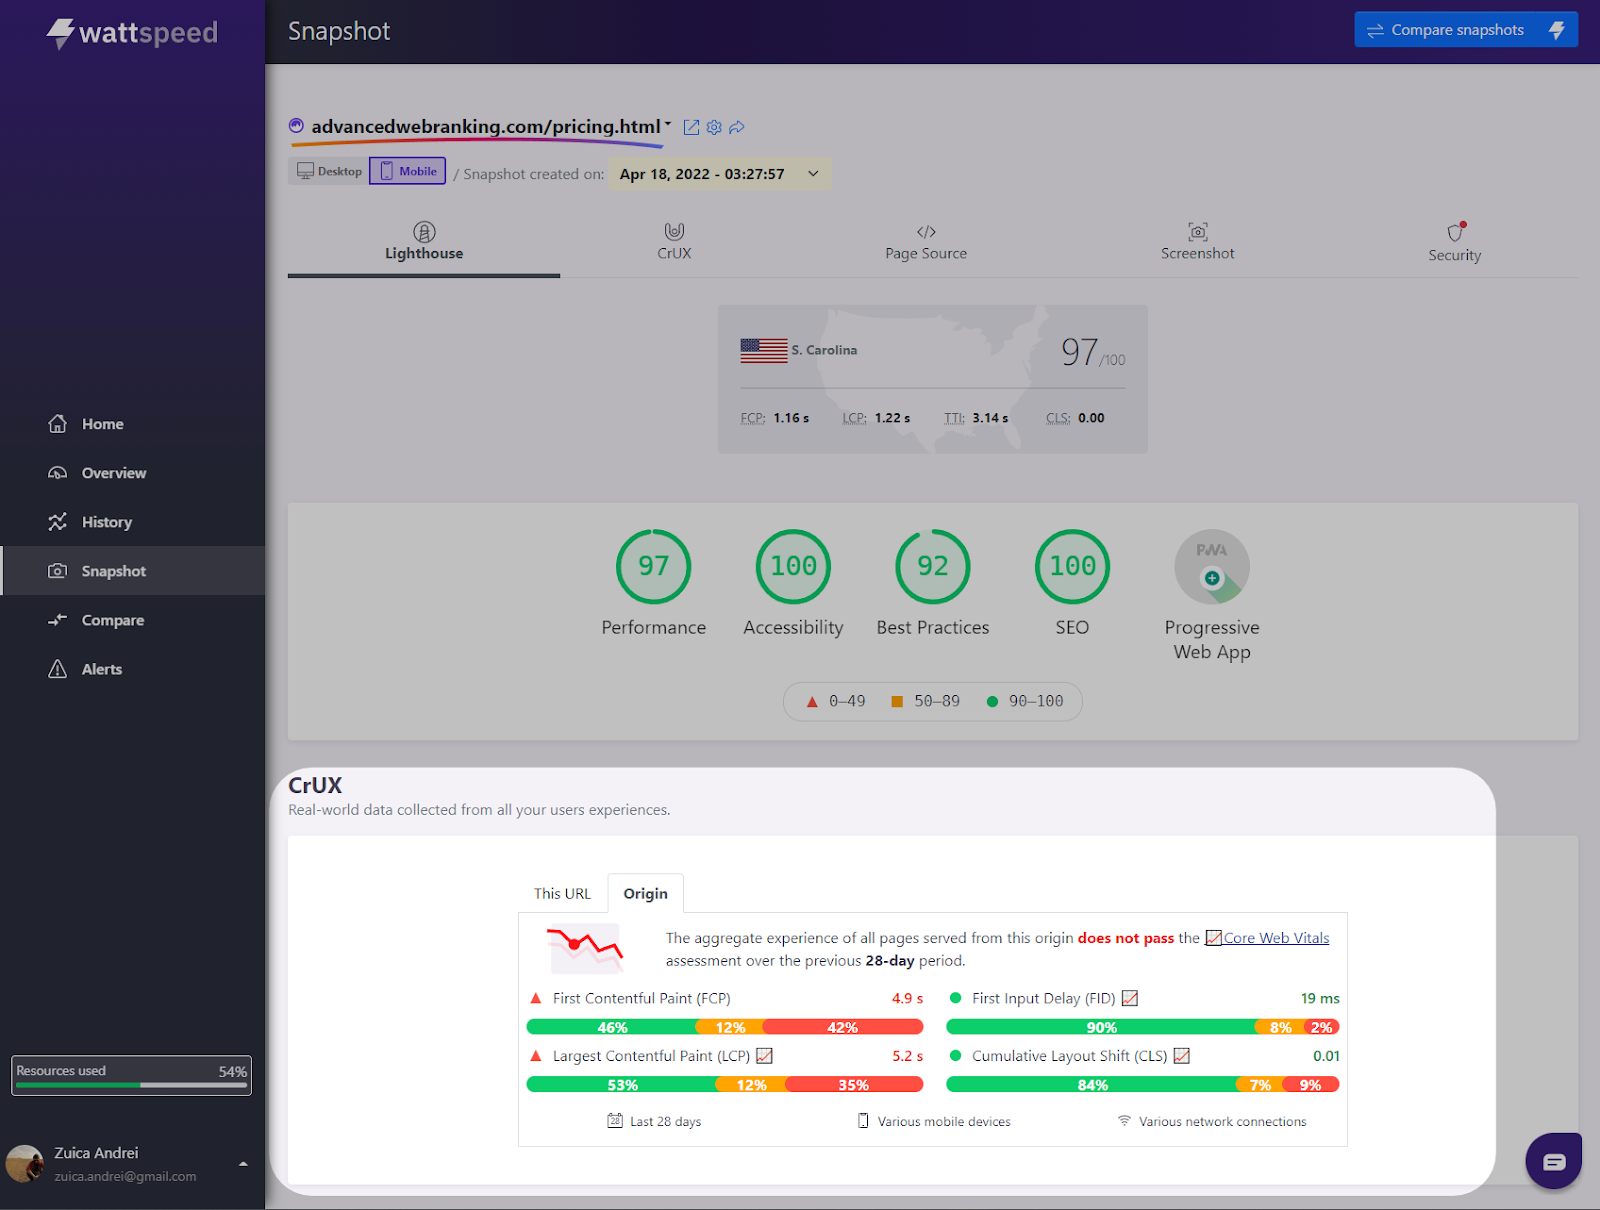
Wait, 28 days? Yes, that’s how the Core Web Vitals are measured via CrUX (Chrome UX Report), so in other words, if you do some improvements today, you may need to wait in order to see the changes.
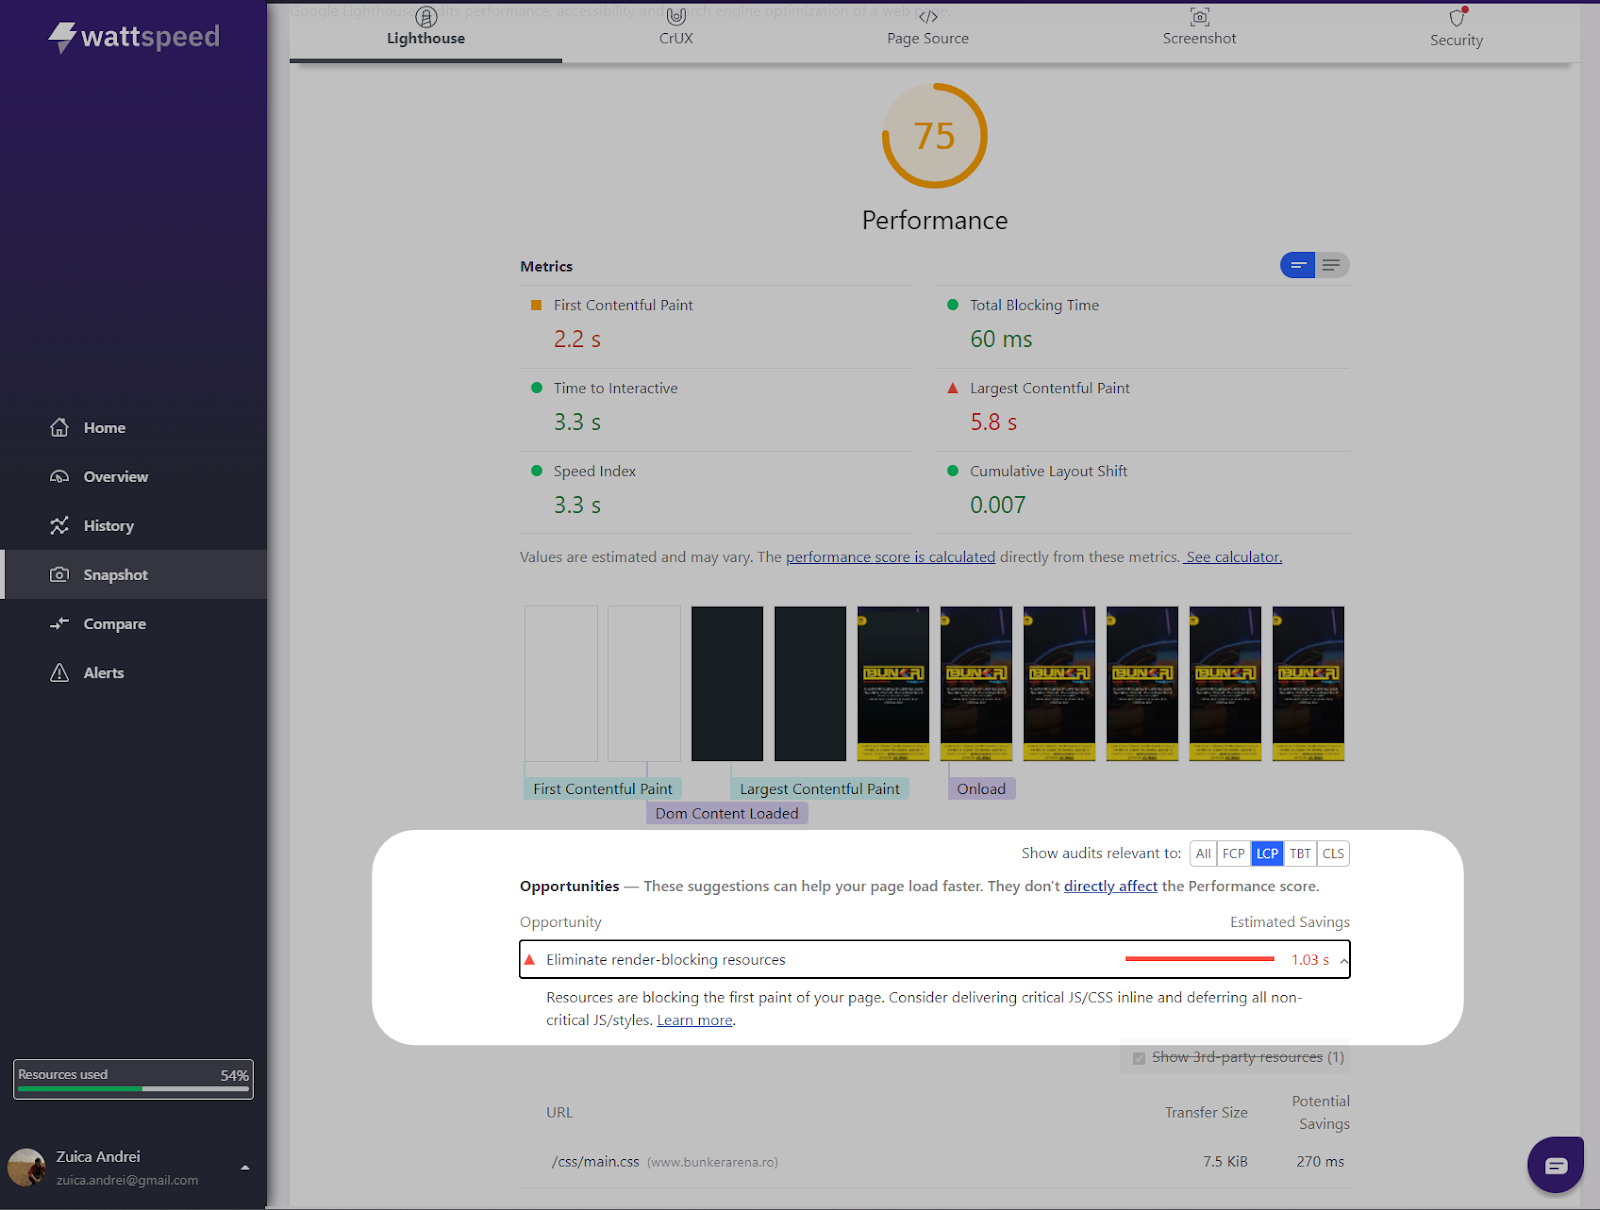
But we are here to help you. Right after you did your improvements, you can generate another snapshot so in the Lighthouse section you will see a synthetic analysis made at this moment so you can figure out if your CWV will improve or not.
Also, in the same Lighthouse section, you can see exactly what you can improve in order to get a better score for each metric, by using the filter in the right corner.
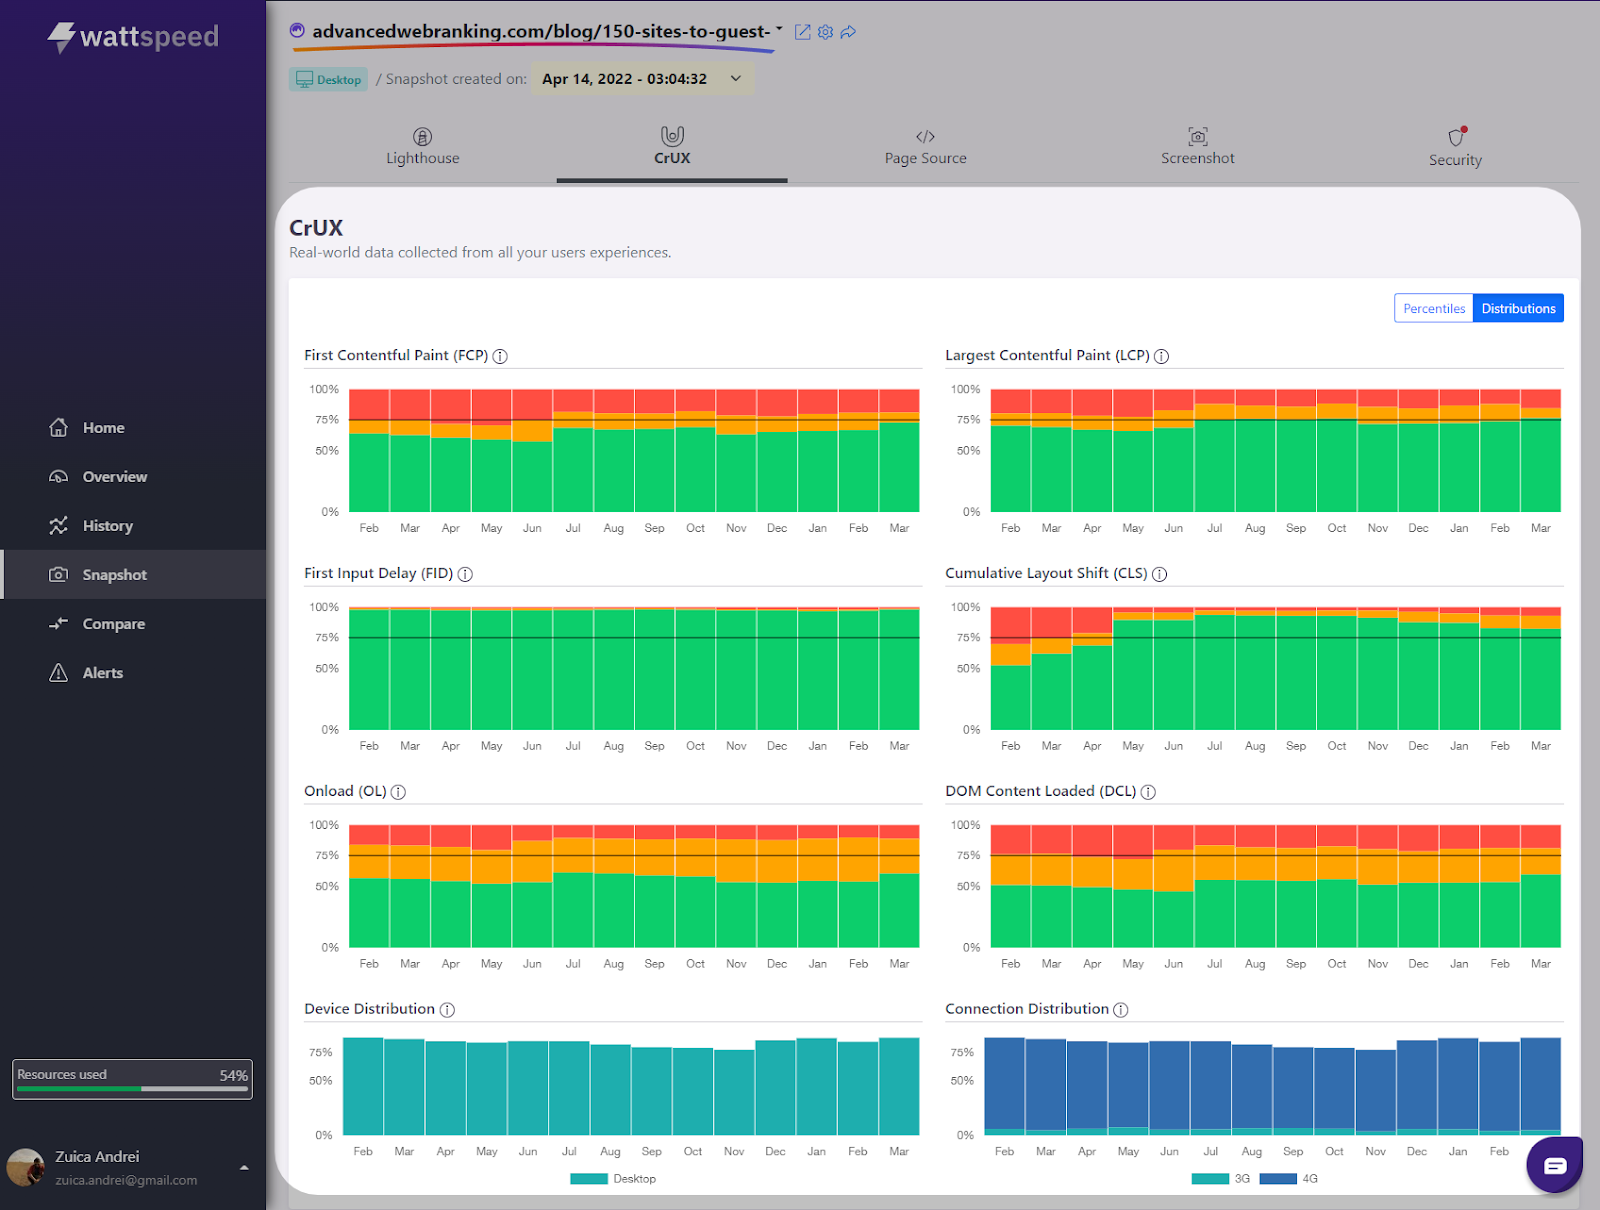
If you ever need to see the CWV history for the last 12 months, just head to the CrUX section, so you will see how each metric performed over the last 12 months. There may be cases when there is not enough CrUX data. That’s happening because the webpage has not enough traffic.
Did you manage to pass the Core Web Vitals?
This article is the first of our Core Web Vitals series, stay tuned for more interesting insights on how to optimize each CWV metric.