Overview
The Overview report is the place where you can see information about each domain's URL. This report is made by two sections:
1. KPIs
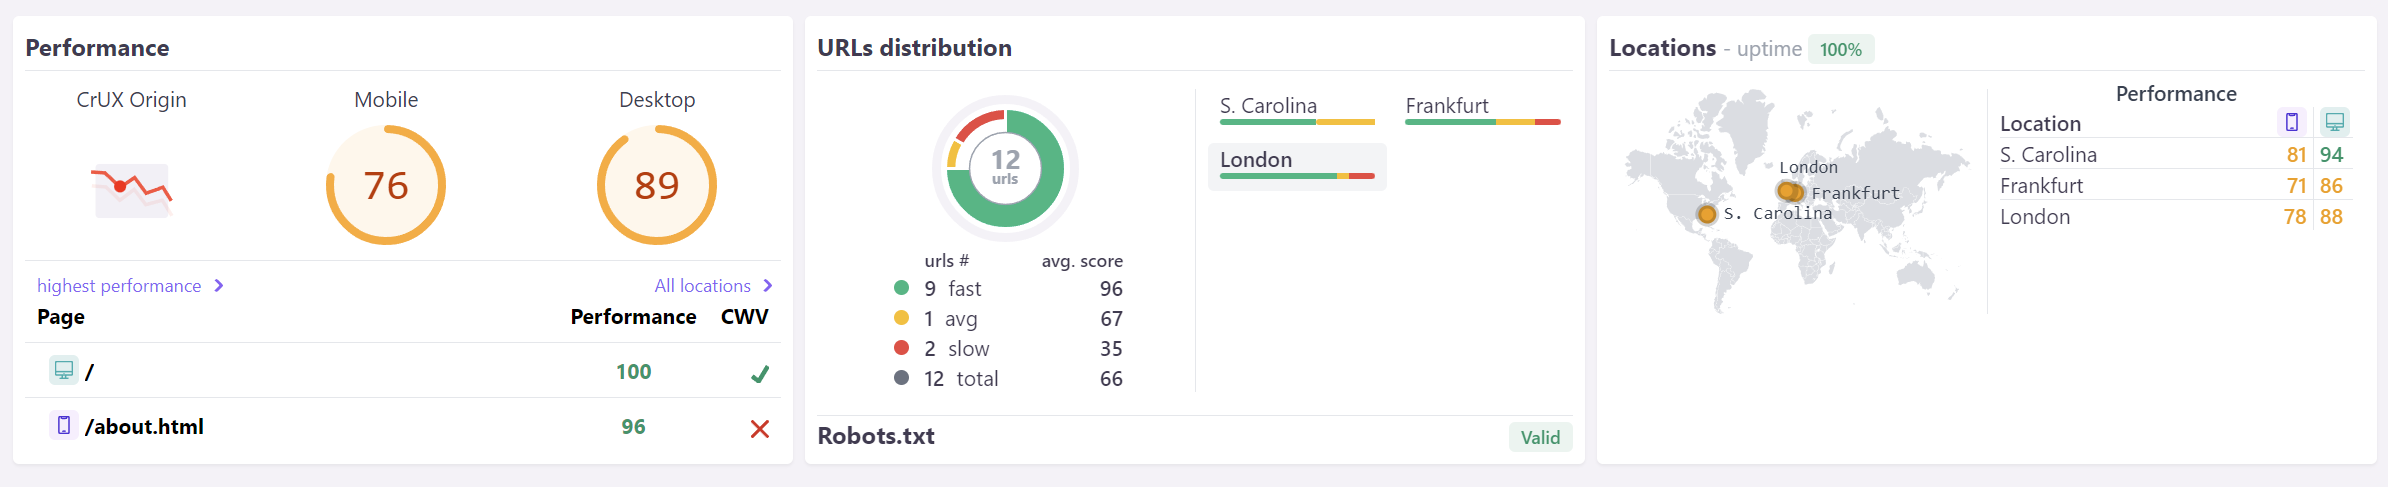
Global data for your domain:
- CrUX Origin - domain's CrUX.
- Average performance - last update's performance for all monitored URLs, split per device.
- Lowest and highest performance - last update's performance for a webpage with option to filter by location, split per device.
- URLs distribution - the percent of slow, average and fast URLs.
- Robots.txt - validation of robots.txt.
- Uptime - the percent of uptime for the last 24h.
- Locations - the places from where your URLs are monitored.
Click on the uptime percent to see the 24h uptime chart.
2. Monitored URLs
The second section lets you monitor the performance, page source and security of all domain's webpages, as well as showing you what you can improve.
There are 4 available views:
Every view has the option to export data as .csv file per moment or scheduled to one or more email addresses.

I. Performance
Shows the most metrics from Lighthouse, LCP, FID and CLS, as well as the Core Web Vitals assessment for the last 28 days and global scores for Performance, SEO, Best Practices, Accessibility and PWA.

Also, you can find the performance score's history for each URL in the Performance column. If you monitor your webpages from multiple locations, the entire row can be switched to the desired location by clicking one of the flags. The URL column will redirect you to the Lighthouse report.
II. Page Source
This tab shows various metrics related to the page source.

- DOM size: The total number of HTML elements on the page.
- Resources: Total resources size.
- Images: The size of all the images found on the page.
- Scripts: JavaScript files size.
- Stylesheets: The size of stylesheets.
- Fonts: Total size of fonts.
- Third-party: The size of external scripts like the ones from Google Tag Manager.
- HTML: Validation status.
- Links: The total number of both internal and external links on the page.
- Broken links: The number of internal and external broken links.
III. Savings
This view of the Overview report lets you know how much size you can save by improving certain parts of your webpage.

Try sorting by desired column in order to see the biggest spenders.
IV. Security
- Vulnerabilities: Third-party scripts with known and public vulnerabilities.
- Headers: The global score for your security headers.
- STS: The status of Strict-Transport-Security header.
- CSP: Content-Security-Policy - CSP header defines allowed sources by content type (e.g. text, images), helping against certain types of attacks, like Cross-Site Scripting (XSS) and data injection attacks.
- XFO: X-Frame-Options - XFO header indicates whether the websites allow the browser to render its pages in a frame. Blocking framing avoids clickjacking attacks. The frame-ancestors directive defined in Content-Security-Policy obsoletes this header for supporting browsers.
- XCTO: X-Content-Type-Options - Server uses this marker to specify that the MIME types used in the Content-Type headers should be respected and not be changed to avoid MIME type sniffing.
- RP: Referrer-Policy - Referrer-Policy controls which referrer information should be included with the requests.
- PP: Permissions-Policy - Permissions Policy has the ability to allow or block browser features and APIs (e.g. access the camera, Geolocation).
- SSL: SSL Certificate validity.
