Web performance monitoring tool
Analyse both real user and synthetic data.
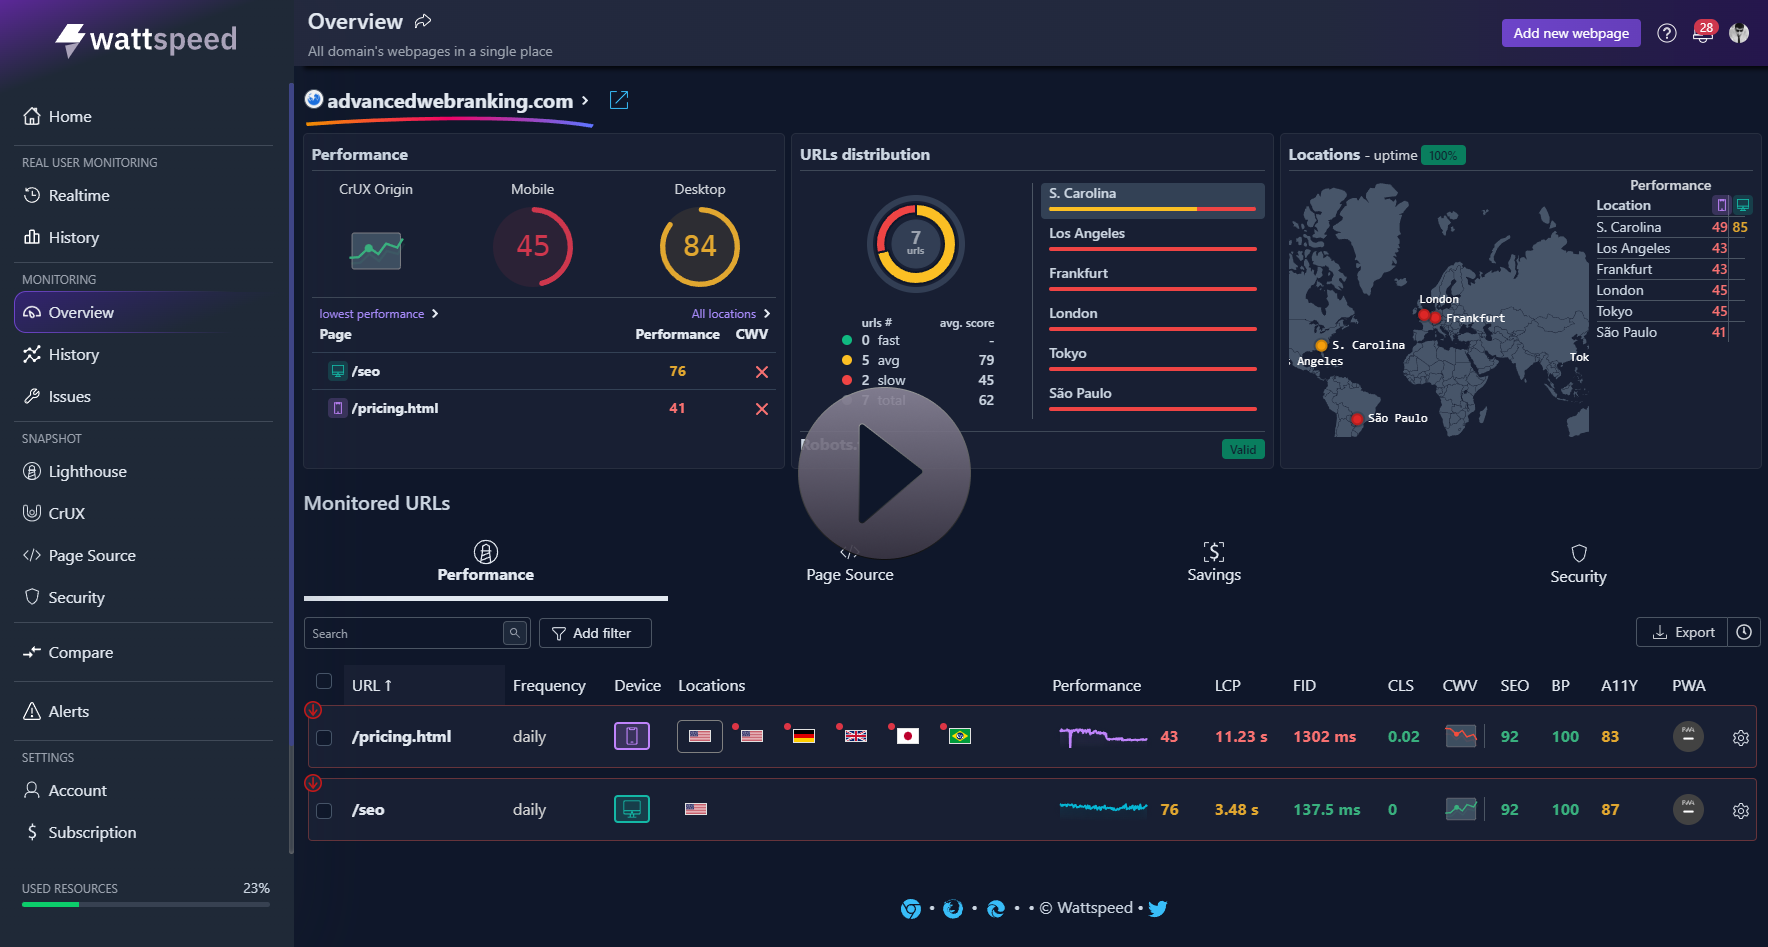
Monitor your website performance and discover what to do next.
How can our Site Monitoring Tool help you?
Measure your website performance
Wattspeed keeps an eye on your site's performance over time. We use tools such as Lighthouse for detailed analysis and tap into real browsing data with the Chrome UX Report to show how users experience your website.
Web Performance Metrics
Track your website's journey with metrics in speed, accessibility (A11Y),
best practices, Progressive Web App (PWA) readiness, and SEO
Tailored Global Perspectives
Receive customized Lighthouse reports from key locations, providing a snapshot
of your site's performance. Think of it as a strategic guide, pinpointing where your optimization
Trends and Comparisons
Track Core Web Vitals over the year to spot performance trends. Use insights to make data-driven improvements, optimising UX and meeting search engine standards.
use case
Monitor performance with
Lighthouse & CrUX data
Use Lighthouse & data from the Chrome User Experience Report (CrUX) to automate the monitoring of your website performance. Set custom locations for your Lighthouse reports and improve your metrics, by comparing snapshots of your pages, as they evolve in time.
- Performance, A11Y, Best Practices and SEO scores in time
- Custom locations Lighthouse report
- Compare snapshots focusing on their differences
- Core Web Vitals signals monitoring for the last 12 months
- In time performance monitoring
use case
In-Depth Analysis for Site Optimization
Gain insights into your site’s foundation with an analysis of its code, technology, and data. Discover optimization opportunities through best practice recommendations, see how your site appears in search results and on social media, and understand its internal structure for enhanced user navigation.
- Summary of best practices & recommendations
- SERP & Social previews
- Technologies, JSON-LD structured data, headings, links & request map
use case
Real User Monitoring
Real User Monitoring, or RUM for short, is a performance monitoring practice that measures actual users’ experience on the given website.
- Reveals how the visitors interact with your website in real-time.
- Powerful dashboard that contains the Core Web Vitals from every location, every page and every device.
- You don't have to wait 28 days for your CWV data.
Reliable Monitoring and Instant Alerts
Check that your website is online right now through our hourly checks of your site’s uptimes and response time. Conclusions are best obtained through neat, simple, and clean charts and logs, that cater for every eventuality, on the site’s performance and reliability. There is no need to exit the application to receive alerts for metric changes and the current scores on your dash and via Slack or email.
Choose the convenience of receiving these critical notifications in your preferred messaging app or directly in your inbox, keeping you informed and ready to act at a moment's notice.
Wattspeed Features
Wattspeed monitors, discovers & helps fixing websites performance issues.
By tracking & benchmarking your websites performance over time,
you will always know what's going on.
Lighthouse Report
Lighthouse audits website performance metrics & gathers user experience metrics. With Wattspeed you can run multiple Lighthouse audits and combine them in order to get more accurate results.
Historical CrUX
The Historical CrUX provides aggregated user experience metrics from actual users over the past 12 months. See trends in user experience that are often influenced by changes in your website’s design, content, or technology stack.
Uptime monitoring & alerting
Uptime website performance monitoring helps safeguard your site's online presence and reputation, keeping user trust and search engine rankings intact.
Using Alerts you’ll be the first to know when something is wrong with your web presence.
Page Source
Page Source examines the HTML, CSS, & JavaScript to identify any issues that may hinder a site’s performance. By optimising the code, page load times & accessibility can be improved while ensuring easy crawling and content indexing from search engines.
Core Web Vitals
Core Web Vitals help site owners & SEO specialists enhance UX by focusing on key aspects of a website performance: ,responsiveness of the website, navigation and the smooth flow and graphics performance. Optimisation of these makes can enhance the usability of the site, and there by contribute to the enhanced customer value.
CI & Developer API
Wattspeed’s Continuous Integration & Developer API seamlessly plugs and plays in your CI processes; having your WebSite tested & Checked on performance. You may use the API for testing, querying, or executing tests and snapshots as desired.
Pricing
Our subscription plans offer complete access to a full range of tools. Whether you're managing a small site or a large online presence, you get the same comprehensive feature set with any plan.
Wattspeed employs a credit-based pricing model that adapts to factors such as: page complexity, monitoring frequency, number of monitored pages, and other variables.
Free
For your personal website
No credit card required
10 credits
each month
Pro
For tiny agencies
Choose how many credits you need each month
credits
each month
/ month
(+ local taxes)
Calculator
How many pages do you want to monitor for a domain?
Not sure how many pages to monitor?
Choose your target location(s)
Update Frequency
Monitor devices
Chrome User Experience Report
Real Users Monitoring
How many domains of this size do you want to monitor?
INFO
INFO
Plans Comparison
Feature | Free | Pro |
|---|---|---|
Unlimited pages | ||
Lighthouse & CrUX data | ||
Page source analysis | ||
Schedule snapshots | ||
Import from sitemap | ||
Slack and email alerts | 1 | unlimited |
Share public link | ||
Realtime Core Web Vitals Monitoring (RUM) New | ||
Uptime monitor | hourly | |
Credits | 10 monthly | 400 / 1000 / 2300 / 5000 / 10000 monthly |
| Median Lighthouse scores | ||
| Multiple locations |
| S. Carolina, Los Angeles, Frankfurt, London, Tokyo, São Paulo |
Core Web Vitals monitoring for the last 12 months | ||
Compare different URLs | ||
GitHub Action, GitLab CI/CD | ||
Developers API | ||
Snapshot via URLs | ||
Issues report | ||
Team | ||
Custom domain |
FAQ
What is Wattspeed?
Can I try Wattspeed for free?
How many users seats can I add to my team?
What is a snapshot?
What are credits?
Can I get a refund?